
Figure 4: Black flying fox RTP4 binds replicating viral RNA and suppresses viral genome amplification.
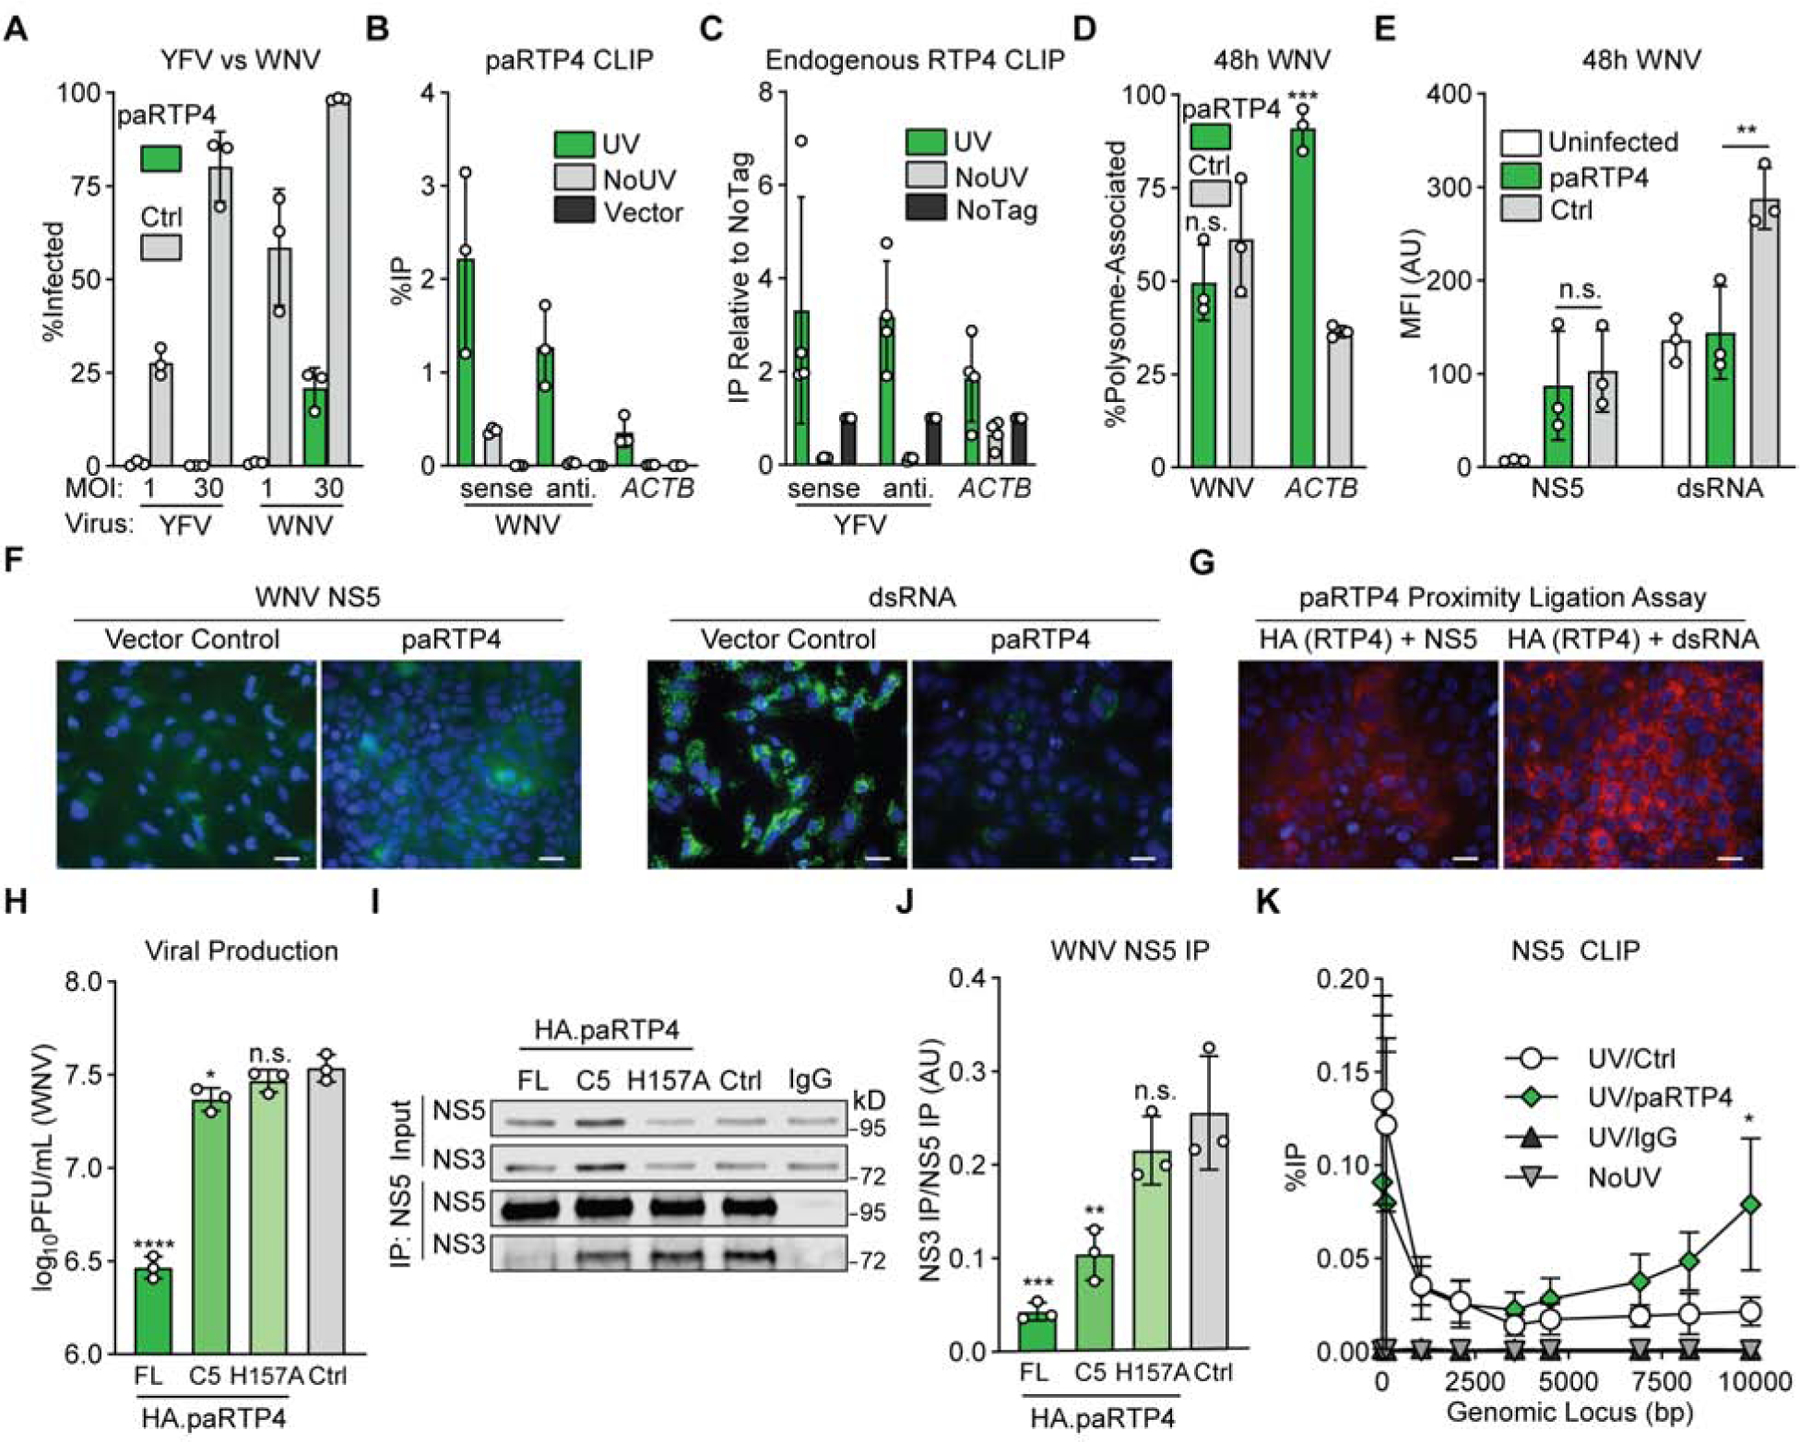
a) Huh7.5 cells expressing HA.paRTP4 or a vector control were infected with WNV or YFV-17D (MOI of 1 or 30) and harvested at 24h. Bars: mean ± SD of N = 3 biological replicates. Related data: Supplemental Figure 4A
b) Huh7.5 cells expressing HA.paRTP4 or a vector control were infected with WNV (MOI of 30) for 48h. CLIP-qPCR identified RNA bound by RTP4. UV: UV crosslinked HA.paRTP4 cells. NoUV: non-crosslinked HA.paRTP4 cells. Vector: UV crosslinked vector control cells. Bars: mean ± SD of N = 3 biological replicates. Related data: Supplemental Figure 4B–C
c) PaKi cells were infected with YFV-17D (MOI of 5) for 48h. CLIP-qPCR identified RNA bound by HA.paRTP4. UV: crosslinked endogenously-tagged cells. NoUV: non-crosslinked endogenously-tagged cells. NoTag: crosslinked wild-type cells. Bars: mean ± SD of N = 4 biological replicates.
d) Polysome association of WNV vRNA and ACTB in Huh7.5 cells expressing HA.paRTP4 or a vector control infected with WNV (MOI of 30) for 48h. Bars: mean ± SD of N = 3 biological replicates. Two-way ANOVA with Holm-Sidak test. Related data: Supplemental Figure 4D
e) Huh7.5 cells expressing HA.paRTP4 or FLuc as a negative control were infected with WNV (MOI of 30) for 48 hours. NS5 and dsRNA levels were quantified by flow cytometry. Bars: mean ± SD of N = 3 biological replicates. Two-way ANOVA with Holm-Sidak test.
f) Huh7.5 cells expressing HA.paRTP4 or a vector control were infected with WNV (MOI of 30) for 48 hours. NS5 and dsRNA levels were visualized by immunofluorescence microscopy. Representative image of N = 3 biological replicates. Scale bar: 30μm.
g) Huh7.5 cells expressing HA.paRTP4 were infected with WNV (MOI of 30) for 48 hours. A proximity ligation assay was performed for HA and either NS5 or dsRNA. Representative image of N = 2 biological replicates. Scale bar: 30μm. Related data (PLA controls): Supplemental Figure 4E.
h) Huh7.5 cells expressing the indicated paRTP4 constructs were infected with WNV (MOI of 30) for 48 hours. Quantification by plaque assay. Bars: mean ± SD of N = 3 biological replicates. One-way ANOVA with Dunnett’s test performed on log-transformed data.
i) Huh7.5 cells expressing the indicated paRTP4 constructs were infected with WNV (MOI of 30) for 48h. WNV NS5 was immunoprecipitated and quantitative western blotting was performed using a Li-COR imager. Representative blot of N = 3 biological replicates.
j) Quantification of (I) showing the co-immunoprecipitation of NS3 by NS5, normalized to NS5 pulldown efficiency. Bars: mean ± SD of N = 3 biological replicates. One-way ANOVA with Dunnett’s test.
k) Huh7.5 cells expressing HA.paRTP4 or a vector control were infected with WNV (MOI of 30) for 48h. CLIP-qPCR with limited nuclease digestion identified the binding profile of NS5 on viral genomic RNA. UV/Ctrl: cross-linked vector control cells, IP NS5. UV/RTP4: crosslinked paRTP4-expressing cells, IP NS5. UV/IgG: crosslinked control cells, IP IgG. NoUV: non-crosslinked vector control cells, IP NS5. Bars: mean ± SD of N = 3 biological replicates. Two-way ANOVA with Holm-Sidak test.