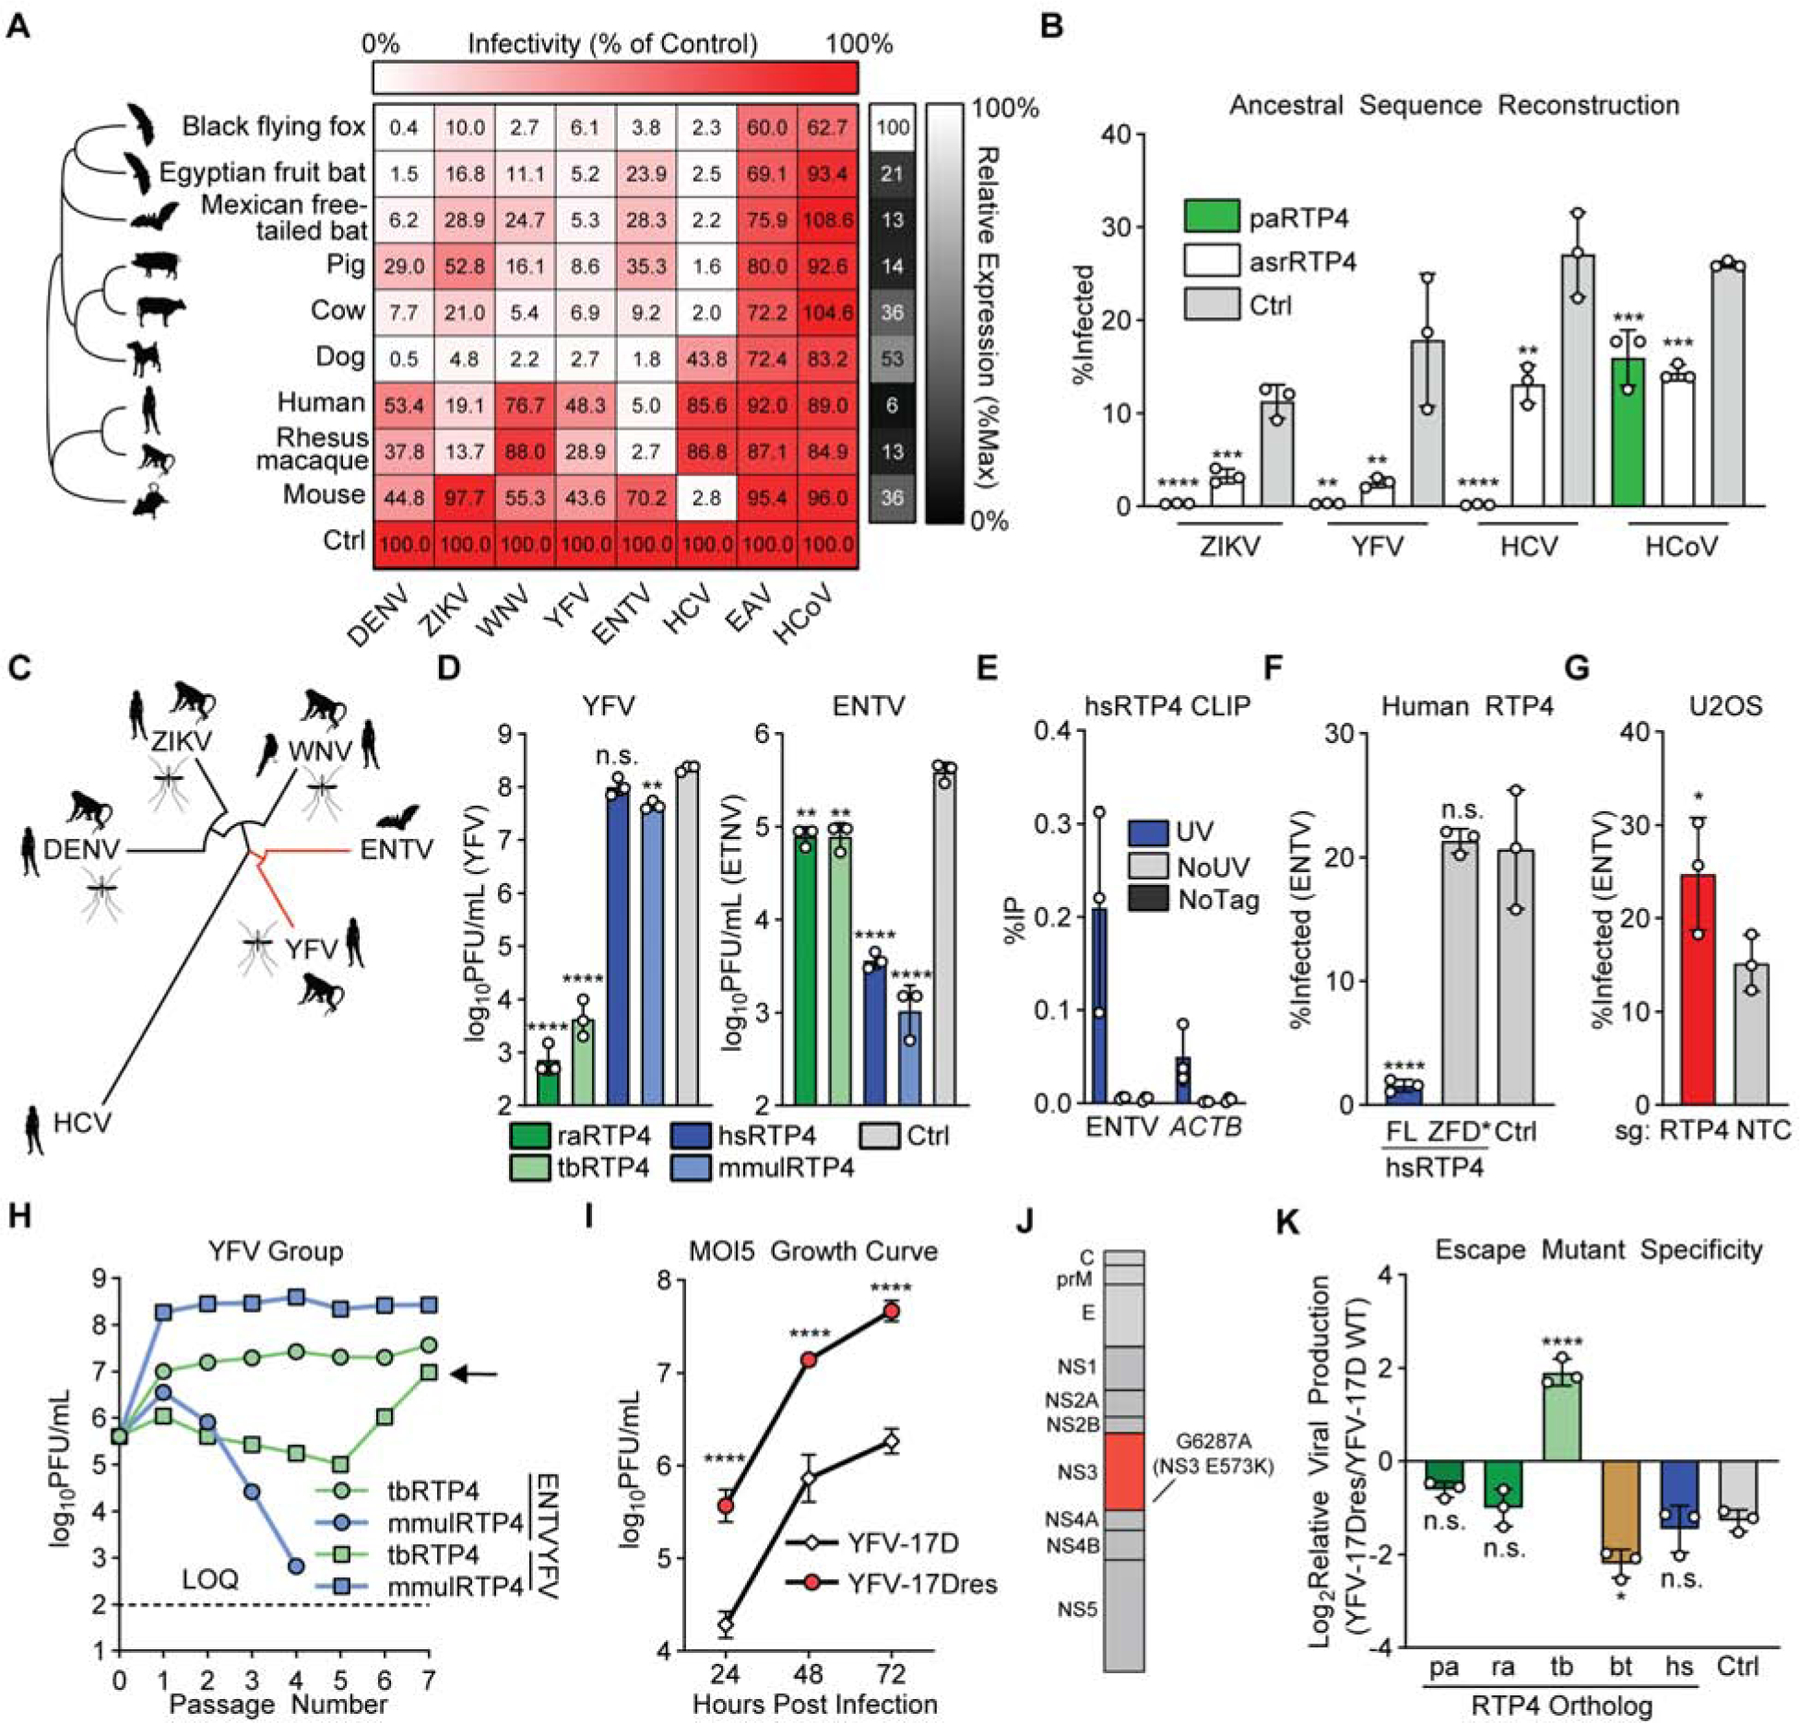
Figure 5: RTP4 is a species-specific mammalian restriction factor.

a) Huh7.5 cells expressing HA-tagged RTP4 orthologs or a vector control were infected with the indicated viruses. Large heatmap: Cells represent the mean infectivity of N = 3 biological replicates, normalized to within-replicate control. Small heatmap: Cells represent the mean protein expression of N = 3 biological replicates, relative to ACTB and normalized to within-replicate maximum expression. Raw infectivity data in Supplemental Table 2.
b) Huh7.5 cells expressing paRTP4, asrRTP4 or a control were infected with the indicated viruses. Bars: mean ± SD of N = 3 biological replicates. One-way ANOVA with Dunnett’s test.
c) Maximum-likelihood phylogenetic tree for polyprotein of flaviviruses screened in 5A. Common amplifying hosts are indicated by silhouettes.
d) Huh7.5 cells expressing the indicated constructs were infected with YFV-17D and ENTV (MOI of 0.05) for 24h (ENTV) or 48h (YFV). Quantification by plaque assay. Bars: mean ± SD of N = 3 biological replicates. One-way ANOVA with Dunnett’s test performed on log-transformed data.
e) Huh7.5 cells expressing either HA-tagged hsRTP4 or untagged hsRTP4 as a control were infected with ENTV (MOI of 5) for 24h. CLIP-qPCR identified RNA bound by RTP4. UV: UV-crosslinked HA.hsRTP4 cells. NoUV: non-crosslinked HA.hsRTP4 cells. NoTag: UV-crosslinked hsRTP4 cells. Bars: mean ± SD of N = 3 biological replicates.
f) Huh7.5 cells expressing the indicated hsRTP4 constructs were infected with ENTV at an MOI of 0.5 for 16h. Bars: mean ± SD of N = 3 biological replicates. One-way ANOVA with Dunnett’s test.
g) CRISPR-targeted U2OS cells were infected with ENTV (MOI of 2.5) for 24 hours. Bars: mean ± SD of N = 3 biological replicates. Paired two-tailed t-test.
h) Cells expressing rhesus macaque (mmul) or Mexican free-tailed bat (tb) RTP4 were infected with ENTV or YFV-17D (MOI of 5). Supernatant was collected at 24h (ENTV) or 48h (YFV) and transferred to naive cells for seven passages. Quantification by plaque assay. Points represent N = 1 plaque assay.
i) Huh7.5 cells expressing tbRTP4 were infected with YFV-17D or YFV-17Dresp (MOI of 5) for 72h. Quantification by plaque assay. Points indicate the mean ± SD of N = 3 biological replicates. Two-way ANOVA on log-transformed data with Holm-Sidak test
j) Cartoon representing the YFV polyprotein. NS3 point mutation is indicated.
k) Huh7.5 cells expressing the indicated RTP4 constructs or a vector control were infected with YFV-17D or YFV-17Dresc (MOI of 5) for 24h. Quantification by plaque assay. The ratio of viral production from wild-type YFV-17D and YFV-17Dresc is shown. Bars: mean ± SD of N = 3 biological replicates. One-way ANOVA with Dunnett’s test. Related data: Supplemental Figure 6J–K.
