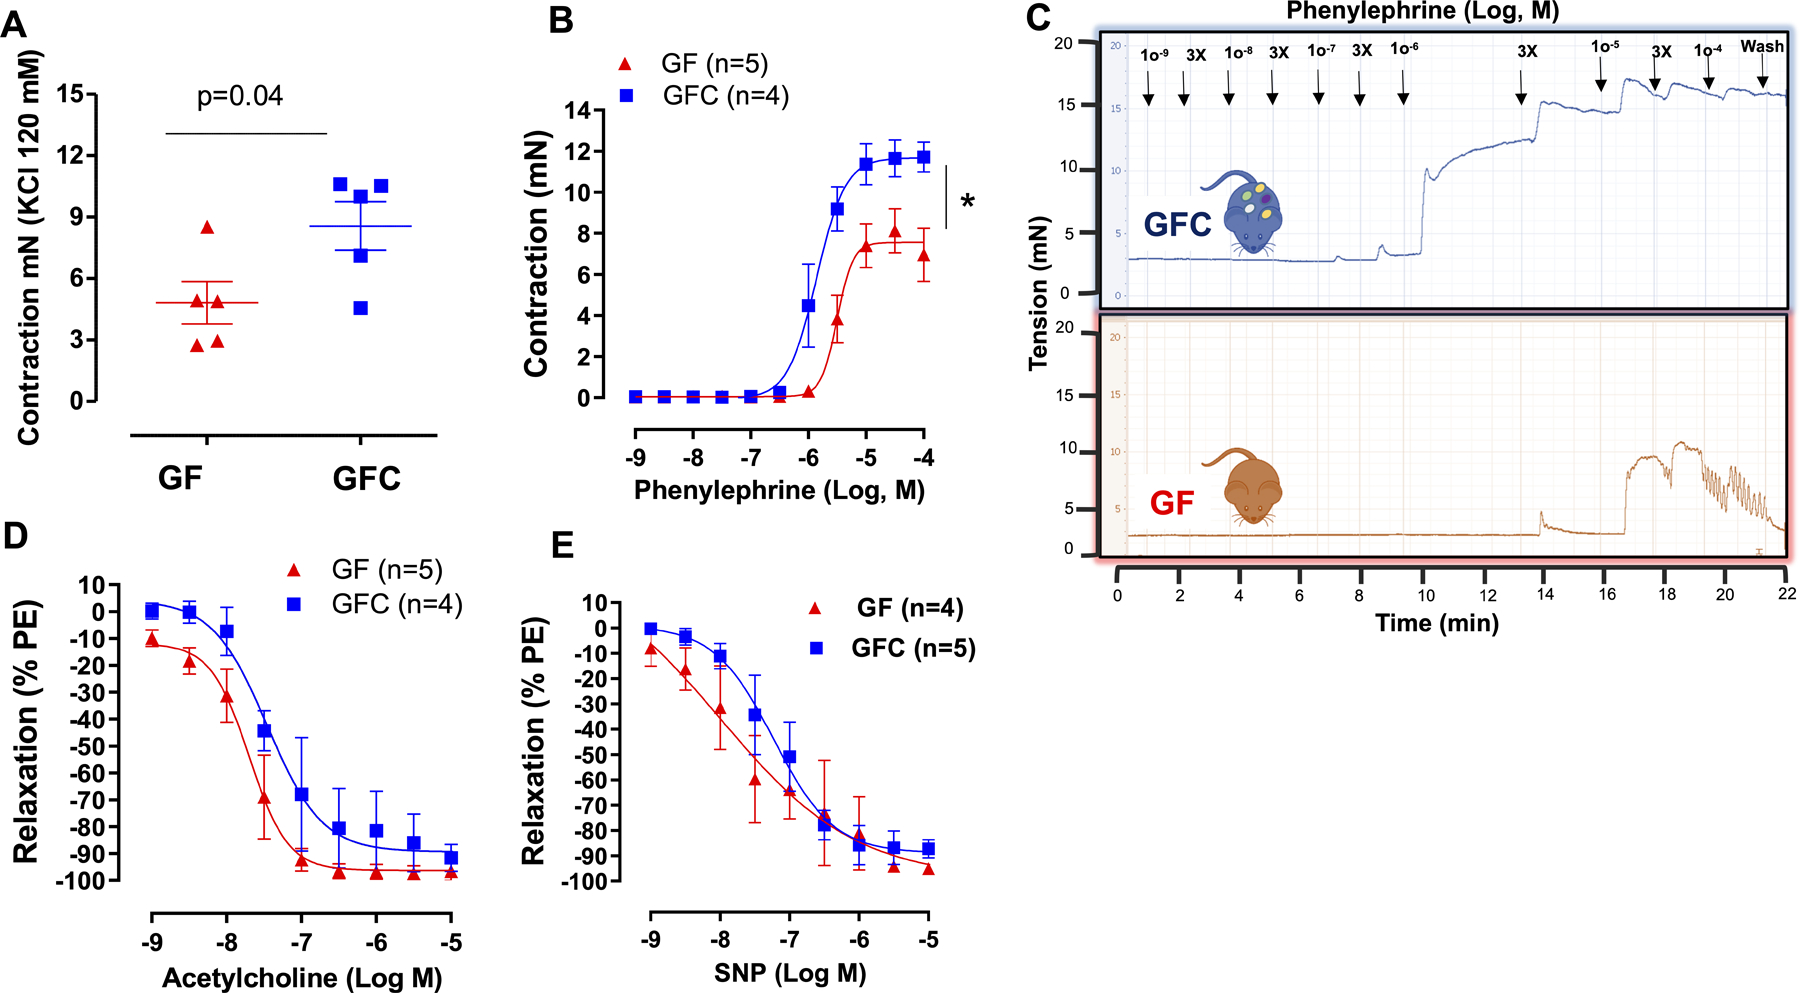
Figure 3.

Contraction to KCl (120 mmol/L) (A) and concentration response curves to phenylephrine (B and C), acetylcholine (D) or sodium nitroprusside (SNP) (E) in mesenteric resistance arteries (MRA) from male 7-week-old Sprague Dawley (SD) rats that were either germ-free (GF) or germ-free conventionalized (GFC). For relaxation curves, arteries were contracted with phenylephrine (10 μmol/L). Number of animals and p values are indicated in the graphs. Data are presented as mean ± SEM. Two-way ANOVA or Student’s t test; *vs. GF. p<0.05.
