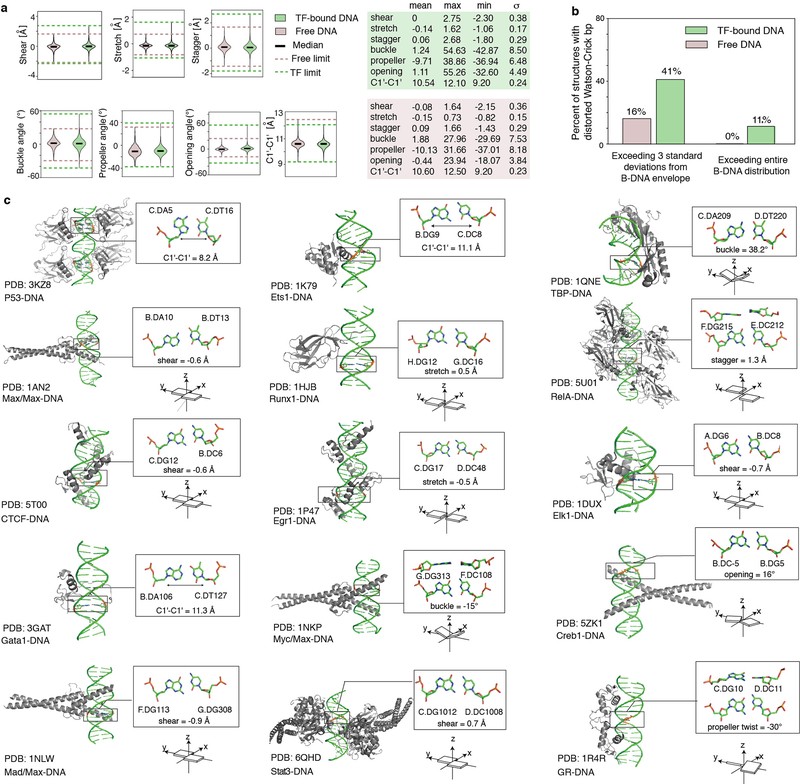
Extended Data Figure 1.
(a) Distributions of base pair parameters in free and TF-bound DNA, from PDB34 survey. Solid lines denote the median value of each parameter. Dashed lines denote the upper and lower bounds of the distribution for free (pink) and bound (green) DNA. 613 TF-bound structures and 409 free B-DNA structures, all with resolution < 3 Å, were used in the analysis (Methods).
(b) Percentage of structures with base pairs outside the B-DNA envelope. Among the 613 TF-bound structures, 41.1% (i.e. 252) contain severe distortions of at least one base pair outside the free B-DNA envelope, with the envelope defined as at most 3 standard deviations above or below the mean. Only 16% (i.e. 65) of the free B-DNA structures satisfy this criterion. (Using a less stringent definition of the B-DNA envelope, by considering 2 standard deviations above or below the mean, we found that 80.8% of the TF-bound structures contain at least one base pair outside the free B-DNA envelope, approximately twice the frequency observed in free DNA, which was 41.8%.) Considering the full range of base pair parameter values as defining the free B-DNA envelope, we found that 11.3% (i.e. 69) of the TF-bound structures contain at least one base pair with an extreme deformation that was never observed in any free DNA structure.
(c) Local deformations of base pairs observed in diverse TF-DNA complex structures. Left: 3D structures with the distorted base pairs highlighted in black boxes. Upper right: enlarged view of the base pair structures with their base pair parameters labeled. Lower right: schematic diagram of the corresponding base pair parameters.

