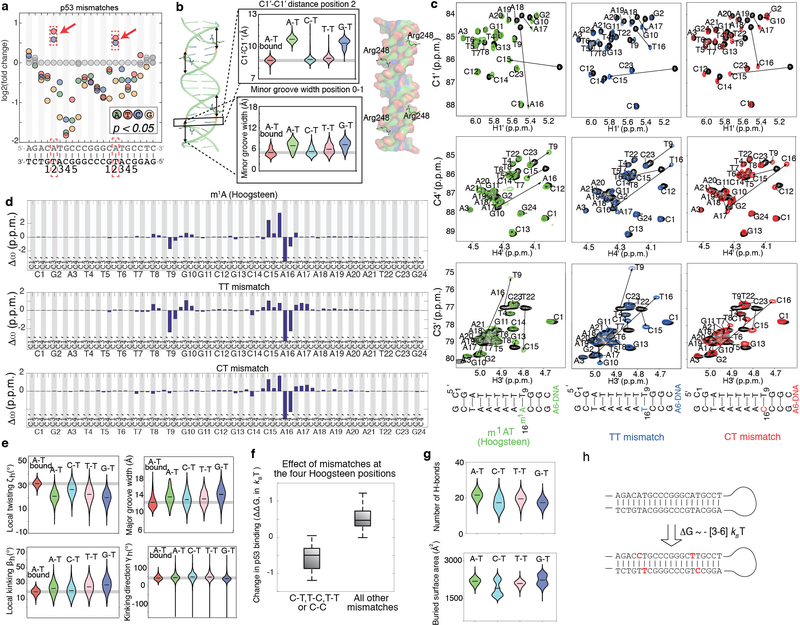
Extended Data Figure 6. The effects of mismatches on p53-DNA binding.
(a) Mismatch profile for p53 reveals that increased TF binding occurs only due to C-T and T-T mismatches (red rectangle) at the same positions where the Hoogsteen conformation is observed in p53-DNA complexes (PDB ID: 3KZ8).
(b) MD simulation-based violin plots of C1’- C1’ distance at position 2, as well as the minor grove width (at position 0–1), for p53-bound DNA and naked DNA (wild-type and mismatched) reveals that the minor groove for C-T and T-T mismatches is more similar to the bound form compared to the free A-T base pair. Plot also shows that the G-T mismatch, which reduces p53 binding, does not mimic these distortions seen in the bound DNA. Notably, a narrower minor grove at position 0–1 was previously suggested to be important for the interaction of the DNA with the Arg248 residue in p5327.
(c,d) NMR validation showing that T-T and C-T mimic the reduced C1’-C1’ distance observed in p53-bound DNA27,28. (c) Chemical shift overlays of the 2D HSQC NMR spectra of the C1’-H1’, C4’-H4’ and C3’-H3’ regions for A6-DNA m1A in which the m1AT base pair is in the Hoogsteen conformation30 (left, green), A6-DNA TT (middle, blue) and A6-DNA CT (right, red) with unmodified A6-DNA (black) at pH 6.9, 25 °C. (d) Bar plots of the individual chemical shift differences (relative to unmodified A6-DNA) of the C1’/C3’/C4’ carbons of A6-DNA m1A (top), A6-DNA TT (middle) and A6-DNA CT (bottom). Similarity between the Hoogsteen induced chemical shift differences and mismatch shifts (relative to the Watson-Crick wild-type) are observed for both T-T and C-T.
(e) Additional comparisons of global features (twisting angle, local kinking, and kinking direction at position 2 and major groove width at position 0–1) reveal additional mimicry between C-T mismatch and the Hoogsteen conformation local twisting angle.
(f) Pyrimidine-pyrimidine mismatches (C-T, T-C, T-T and C-C) in all 4 positions in which Hoogsteen conformation is observed (n=16 mismatches total), increased p53 binding. However, all other mismatches at these positions (n=32 mismatches total) decreased p53 binding, or had non-significant effects. ΔΔG represent the differences between the p53-DNA binding energy of each mismatch versus the WT sequence, and were estimated using the calibration with EMSA measurements (Methods). Boxplots show median signals over all mismatches, with the bottom and top edges of each box indicating the 25th and 75th percentiles, respectively. The whiskers extend to the most extreme data points not considered outliers.
(g) Number of p53-DNA H-bonds and buried surface area at p53-DNA interface, obtained from MD simulations, failed to explain the observed increase in p53 binding, consistent with the pre-paying mechanism being an important determinant for binding in this case.
(h) DNA hairpin with 4 mismatches (in the 4 positions for which the Hoogsteen conformation was previously observed), strongly binds p53: 3–6 kBT stronger (depending on the data used for validation, Supplementary Tables 3, 4) compared to the highest-affinity p53 binding sites previously reported22. Notably, we expect the difference in binding affinity to other genomic p53 sites (ΔΔG) to be even larger since most p53 binding sites in the genome are of lower binding affinities22.

