
Figure 3. Ablation of NPYDBH sympathetic cells caused an increase in LPS-induced TNF-α production.
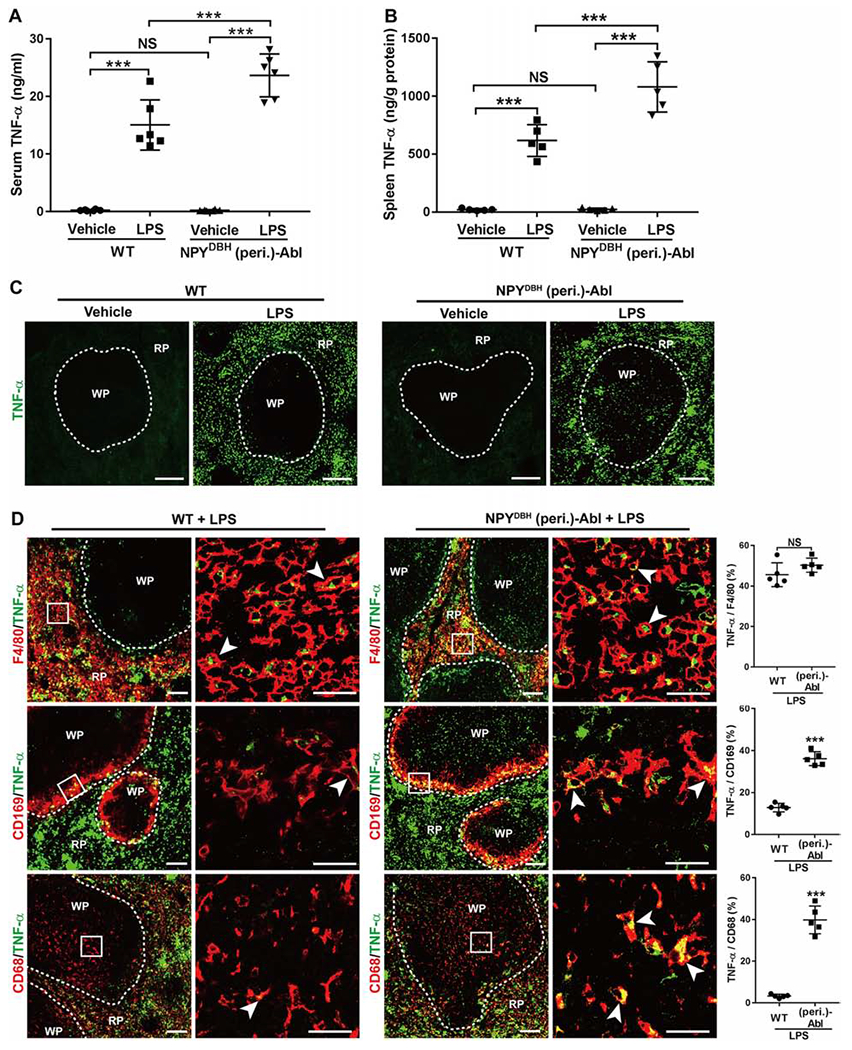
(A-B) LPS induced a larger increase of TNF-α levels in NPYDBH (peri.)-Abl mice compared with WT mice in serum and in spleen. Two-way ANOVA plus post-hoc Tukey test. Serum: F1, 20 = 13.457, P = 0.002; spleen: F1, 16 = 13.174, P < 0.001. ***P < 0.001; NS, not significant, P = 0.913 in A and 0.892 in B.
(C) TNF-α immunostaining images through splenic red pulps (“RP”) and white pulps (“WP”).
(D) TNF-α expression (by immunostaining) in splenic macrophages with indicated markers in LPS-treated wild type (WT) versus NPYDBH (peri.)-Abl mice (two-side student’s unpaired t test; t8 = 1.528 for F4/80, NS, not significant, P = 0.165; t8 = 13.36 for CD169 and 12.22 for CD68, ***P < 0.001). Arrowheads indicate co-localized cells.
N = 5 mice for all groups. Data are shown as mean ± SEM. Scale bars, 100 μm.