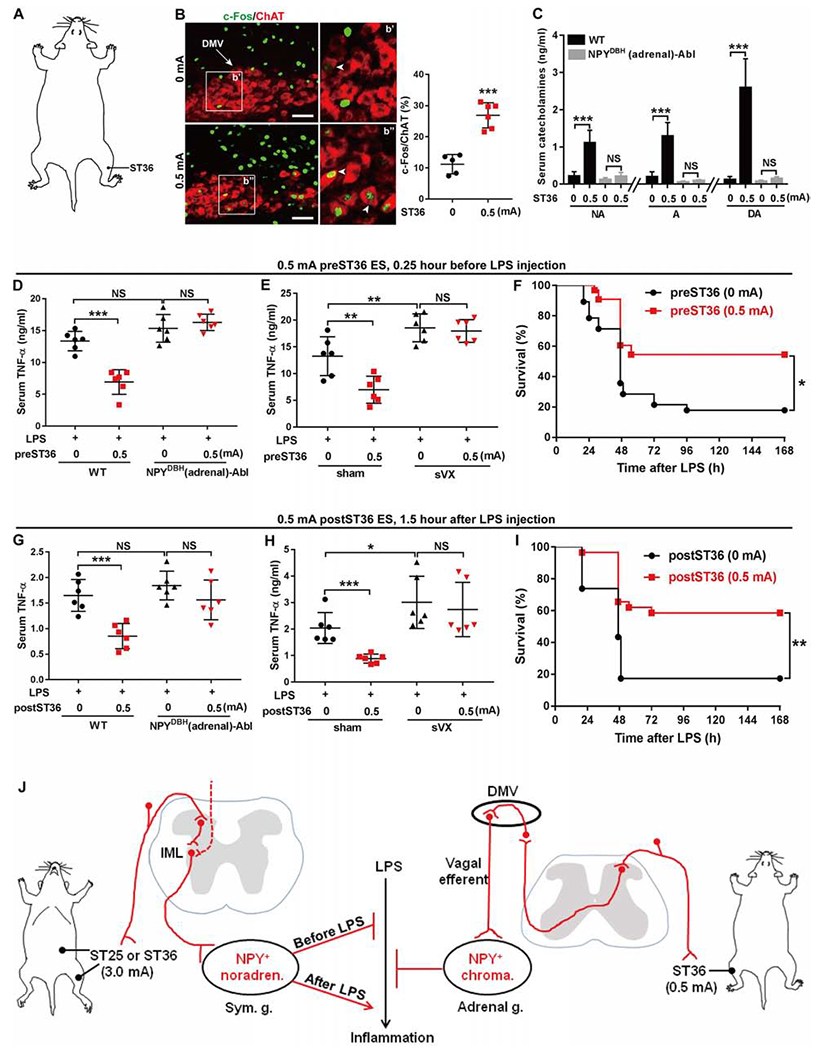
Figure 6. 0.5 mA ES at ST36 attenuated ongoing systemic inflammation.

(A) Schematic showing the hindlimb ST36 acupoint.
(B) ES induced c-Fos in ChAT+ neurons in the dorsal motor nuclei of the vagus (“DMV”). Arrowheads: co-expression. Two-side student’s unpaired t-tests, t9 = 7.09, ***P < 0.001.
(C) 0.5 mA ST36 ES increased catecholamine release (“NA” for noradrenaline, “A” for adrenaline, “DA” for dopamine) in WT, but not in NPYDBH (adrenal)-Abl mice [F1, 20 = 40.560 (“NA”), 69.780 (“A”), 60.912 (“DA”), P < 0.001; ***P < 0.001; NS, P = 0.483 (“NA”), 0.734 (“A”), and 0.757 (“DA”)].
(D) 0.5 mA preST36 ES reduced LPS-induced TNF-α in WT, but not in (adrenal)-Abl mice (F1,20 = 20.457, P < 0.001; ***P < 0.001; NS, left, P = 0.064, right, P =0.893).
(E) 0.5 mA preST36 ES reduced LPS-induced TNF-α in mice with sham surgery, but not with subdiaphragmatic vagotomy (“sVX”) (F1, 20 = 72.188, P < 0.001;**P < 0.01; NS, P = 0.628).
(F) 0.5 mA preST36 ES promoted survival compared with 0 mA ES (0 mA, n = 28; 0.5 mA, n = 33, log-rank test, *P = 0.019).
(G) 0.5 mA postST36 ES reduced LPS-induced TNF-α in WT, but not in (adrenal)-Abl mice (F1, 20 = 23.155, P < 0.001; ***P < 0.001; NS, left, P = 0.147, right, P =0.550).
(H) Loss of 0.5 mA postST36 ES-evoked TNF-α reduction by subdiaphragmatic vagotomy (“sVX”) compared with sham surgery (F1, 20 = 81.237, P < 0.001; ***P < 0.001; *P = 0.025; NS, P = 0.315).
(I) 0.5 mA postST36 ES improved survival compared with 0 mA ES (0 mA, n = 23; 0.5 mA, n = 28, log-rank test, **P = 0.001).
(J) ES drives two autonomic pathways and modulates LPS-induced inflammation in somatotopy-, intensity-, and disease state-dependent manners. Sym. g.: sympathetic ganglia. IML: spinal intermediolateral nuclei. Adrenal g.: adrenal gland. Noradren.: Noradrenergic. Chroma.: Chromaffin.
n = 5–6 mice for all groups (except F and I). Two-way ANOVA plus post hoc Tukey’s test (C, D, E, G, and H). NS, not significant. Data are shown as mean ± SEM. Scale bars, 100 μm.
