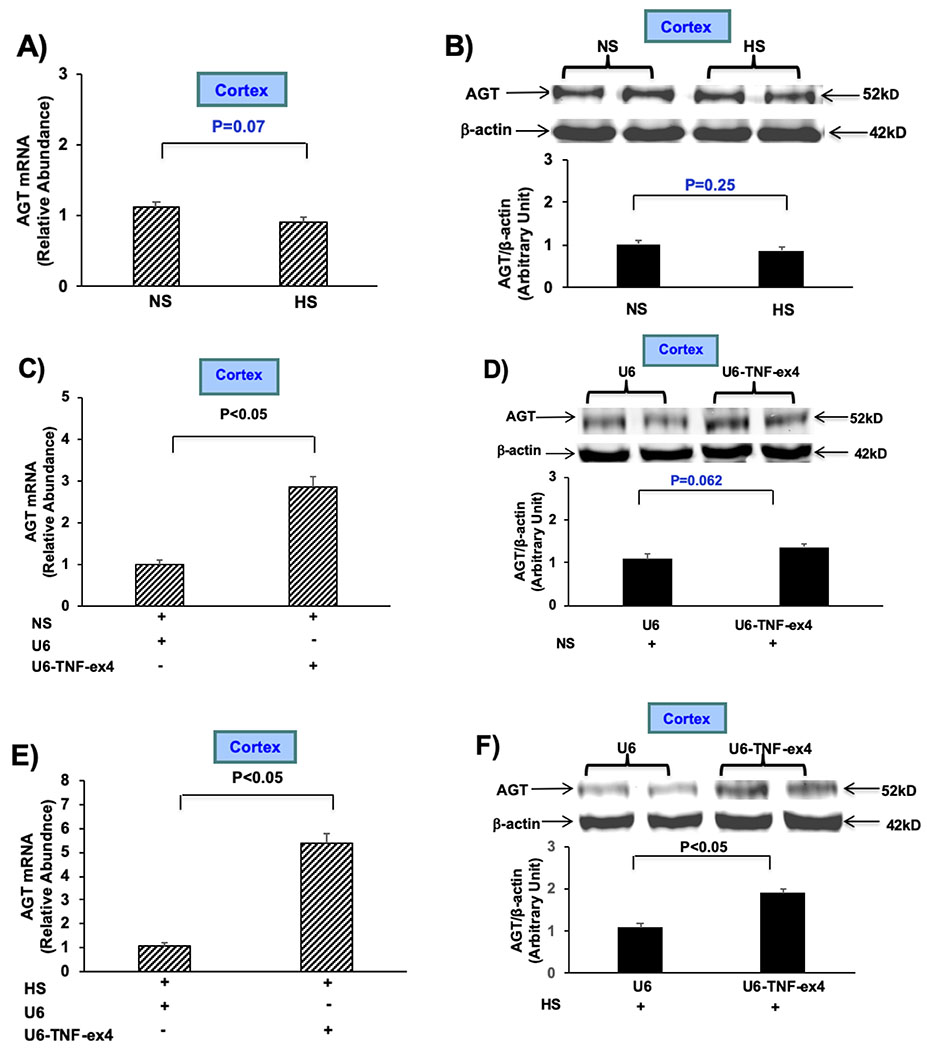
Figure 2: Effects of TNF on renal cortical AGT expression during normal and high salt intake:

A): AGT mRNA expression was measured by RT-PCR after mice were given NS or HS for 7 days. B): Western blotting of AGT (top) and anti-β-actin used as a loading control (bottom) was performed in mice given NS or HS for 7 days. C and D): AGT mRNA and protein expression was determined after intrarenal injection of either lentivirus U6-TNF-ex4 (~5 × 10⁷ TU) or U6 constructs into both kidneys of mice followed given NS for 7 days. E and F): AGT mRNA and protein expression was measured after intrarenal injection of either lentivirus U6-TNF-ex4 or U6 constructs into both kidneys in mice given HS for 7 days. Data are shown as mean ± SE; (n=10).
