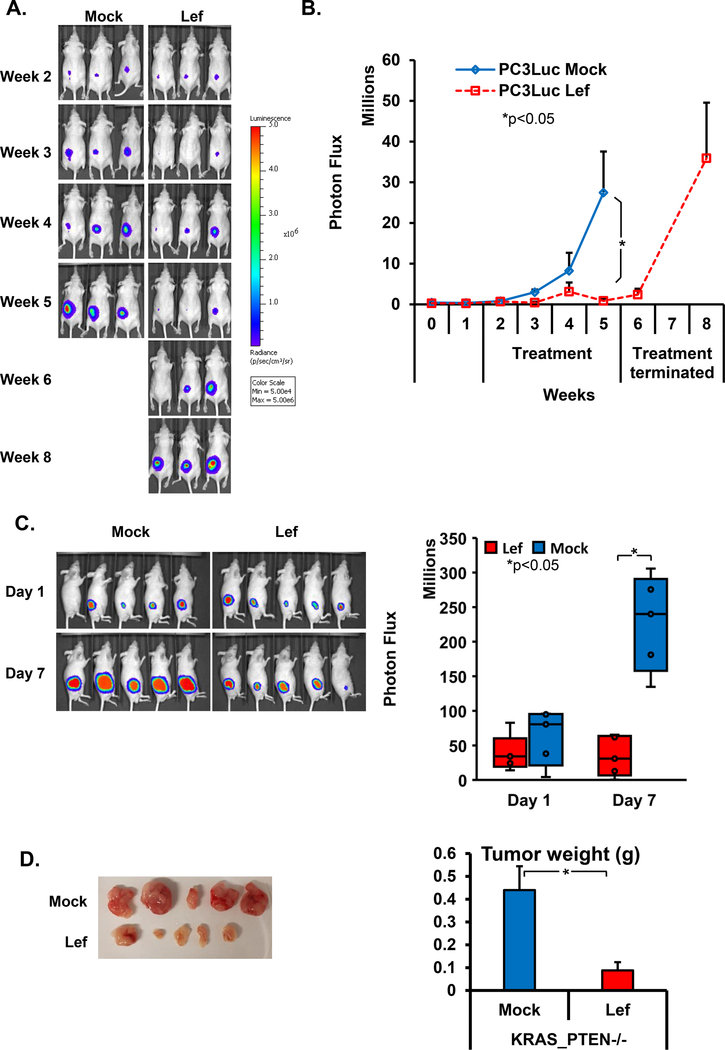
Figure 2:
Leflunomide treatment on PTEN null prostate cancer xenografts. a) IVIS images were collected weekly following the subcutaneous injection of 5 million PC3 cells in mock and leflunomide (200mg/kg) treated groups. Experiments were ended once the predetermined end point of 1cm3 tumor sized was reached. In the leflunomide treated group, after week 4 of the treatment, the drug was withdrawn retreated. b) The quantification of tumors’ sizes based on photon flux (*, P < 0.05 for Student tests, n = 3 per arm). c) IVIS images (left) and quantification (right) following the subcutaneous injection of 5 million Pten−/−; KrasG12D cells in mock and leflunomide (200mg/kg) treated groups (*, P < 0.05 for Student tests, n = 5 per arm). d) Images of tumors (left) and quantification of weights (right) of the endpoint of the experiment in Fig. 2C (*, P < 0.05 for Student tests, n = 5 per arm).

