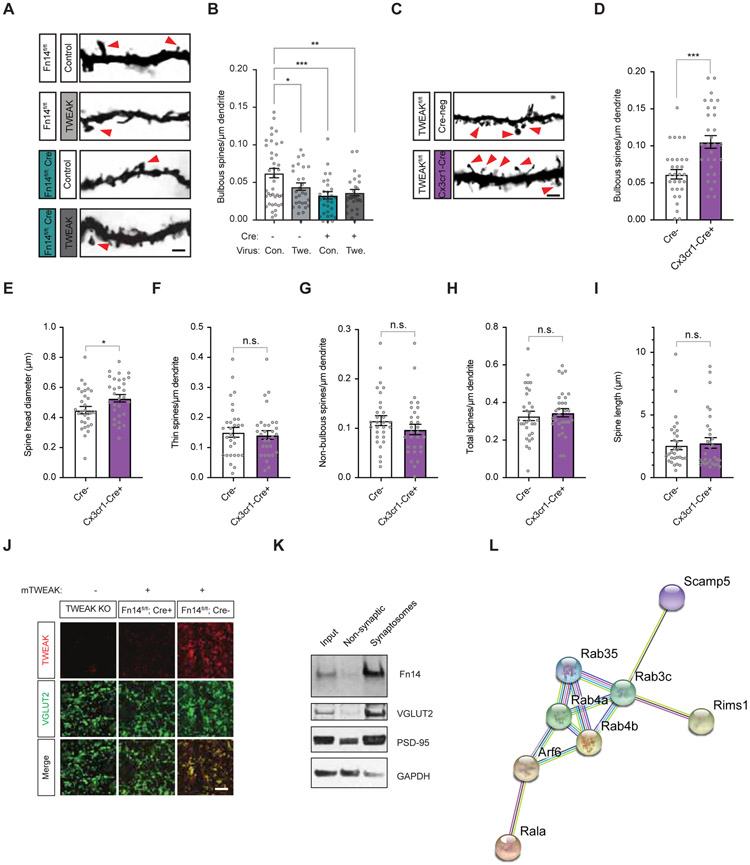
Figure 5. Microglial TWEAK signals through postsynaptic Fn14 to decrease bulbous spine number.
(A) Example images of spines in the dLGNs of Fn14fl/fl Cre-negative or VGLUT2-Cre-positive mice following viral infection. Scale bar, 2 μm.
(B) Quantification of bulbous spine densities following TWEAK or mCherry expression in the dLGNs of Cre-negative (−) and VGLUT2-Cre-positive (+) mice. Comparison between mCherry-infected conditions also plotted in Fig. 2D. Con., control virus. Twe., TWEAK virus.
(C) Example images of spines in the dLGNs of TWEAKfl/fl Cre-negative or Cx3cr1-Cre-positive mice. Scale bar, 2 μm.
(D) Bulbous spine density is increased by genetic ablation of TWEAK in microglia.
(E) Spine head diameter is increased by genetic ablation of TWEAK in microglia.
(F) Thin spine density is unaffected by genetic ablation of TWEAK in microglia.
(G) Non-bulbous spine density is unaffected by genetic ablation of TWEAK in microglia.
(H) Total spine density is unaffected by genetic ablation of TWEAK in microglia.
(I) Spine length is unaffected by genetic ablation of TWEAK in microglia.
(J) Confocal images of dLGNs from a TWEAK KO mouse, a Fn14fl/fl Cre-negative mouse, and a Fn14fl/fl; VGLUT2-Cre+ mouse following bath application of recombinant mouse TWEAK and subsequent immunostaining for TWEAK (red) and VGLUT2 (green). Scale bar, 10 μm.
(K) Western blot of whole mouse forebrain fractionated to enrich for synaptosomes. Blots probed for Fn14, the retinal presynaptic marker VGLUT2, the postsynaptic marker PSD-95, and GAPDH, a non-synaptic control.
(L) Functional protein association network determined by STRING analysis illustrating known and predicted interactions between proteins identified as potential Fn14 interactors by mass spectrometry.
Statistical analysis: (B), One-way ANOVA with Tukey’s post hoc comparison; (D) – (I), Student’s t-test. *p < 0.05; **p < 0.01; ***p < 0.001. Means plotted with individual data points, +/− S.E.M.

