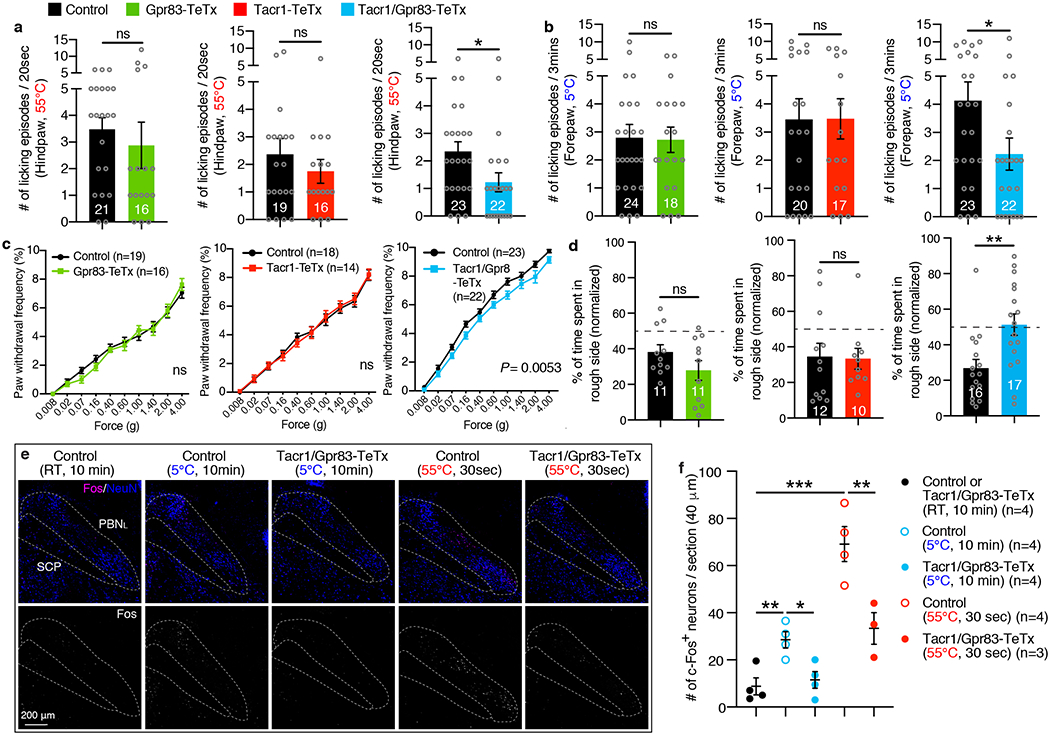
Extended Data Figure 6. Simultaneous inhibition of the synaptic outputs of both Tacr1+ and Gpr83+ SPB neurons attenuates nocifensive behaviors in response to noxious cutaneous stimuli.

a, Hindpaw-licking was scored while Tacr1CreERT2; Lbx1FlpO; Rosa26LSL-FSF-TeTx mice, Gpr83CreERT2; Lbx1FlpO; Rosa26LSL-FSF-TeTx mice, or Tacr1CreERT2; Gpr83CreERT2; Lbx1FlpO; Rosa26LSL-FSF-TeTx mice were placed on the 55°C hot plate (cut-off time, 20 seconds). These intersectional strategies target the entire Tacr1+ and Gpr83+ spinal populations, of which 34.2% (20.5% PBNL-projecting, 6.6% PAG-projecting, and 7.1% MGm/SPFp-projecting PNs are combined) and 30.9% (14.0% PBNL-projecting, 4.6% PAG-projecting, and 12.3% MGm/SPFp-projecting PNs are combined) are Tacr1+ and Gpr83+ PNs (laminaI/IIo and the LSN are combined), respectively (a detailed description of the quantification is in the methods). Two-tailed t-test. b, Forepaw-licking was scored while mice were placed on the 5°C cold plate (cut-off time, 3 minutes). Two-tailed t-test. c, Paw withdrawal frequency following hindpaw skin indentation using von Frey filaments was scored. Two-way ANOVA; p value is indicated; F[1, 43] = 8.65 for Tacr1/Gpr83-TeTx. d, Real-time texture aversion assay (150 grit sand paper vs 400 grit sand paper). % of time spent in rough side of sand paper (150 grit) was measured (normalized to baseline preference). Two-tailed t-test. e, f, The suppression of neurotransmission in the quadruple transgenic mice was confirmed by reduced Fos induction in the PBNL following exposure of mice to noxious thermal stimuli. e, Distribution of Fos+ neurons in the PBNL following thermal stimulation. f, Quantification of the number of Fos+ neurons in the PBNL. One-way ANOVA (Tukey’s multiple comparisons test); F[2, 9] = 8.97 (5°C), F[2, 8] = 27.09 (55°C). n = number of mice (indicated in the graphs). Error bars, s.e.m.
