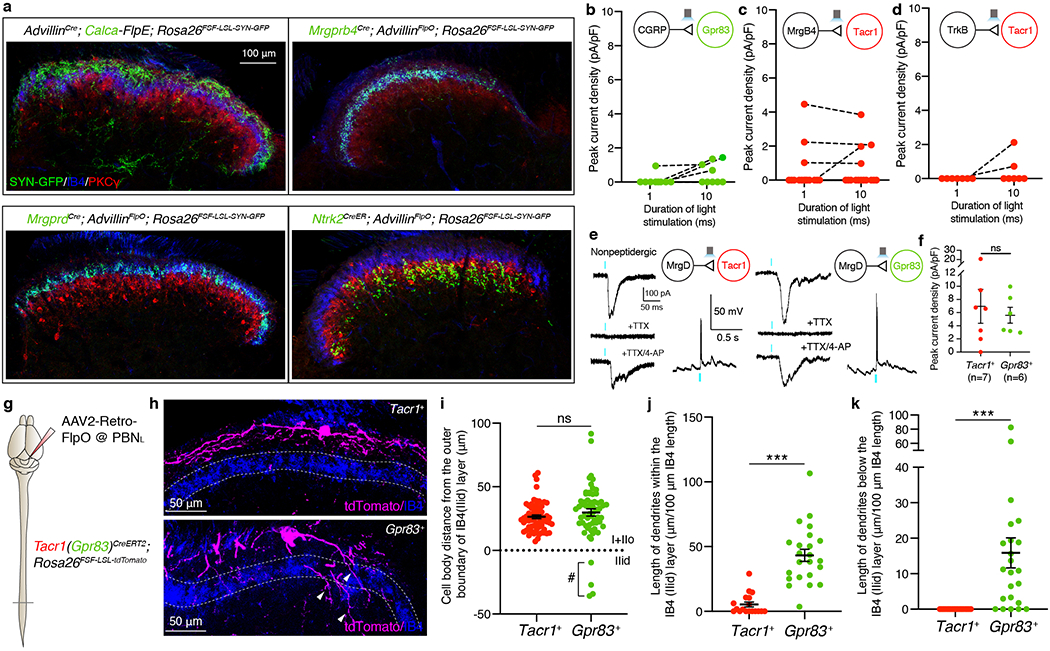
Extended Data Figure 7. Gpr83+ and Tacr1+ SPB neurons receive strong synaptic inputs from Mrgprd+ polymodal non-peptidergic sensory neurons and weak, sparse, and polysynaptic inputs from distinct primary sensory neurons, and exhibit distinct dendritic morphologies.

a, Distribution of CGRP+, Mrgprb4+, Mrgprd+, and Ntrk2+ primary afferent synaptic terminals in the spinal cord dorsal horn. The Rosa26FSF-LSL-SYN-GFP reporter mouse line33 was used in combination with sensory neuron Cre/FlpE mouse lines and AdvillinFlpO/AdvillinCre mouse lines. Note that CGRP+, Mrgprb4+, Mrgprd+, and Ntrk2+ primary afferent synaptic terminals mainly innervate lamina I+IIo, IIid, IIid, and IIiv+III, respectively. b-d, Quantifications of peak current density in Tacr1+ (c, d) and Gpr83+ (b) SPB neurons elicited by long light pulse-stimulation (1 ms and 10 ms) of CGRP+ (b), Mrgprb4+ (c), and Ntrk2+ (d) primary afferent terminals. The same neurons, stimulated with different durations of light stimulation, are connected by dotted lines. Note that only a small fraction of Gpr83+ SPB neurons exhibited long-latency (21.68 ± 2.66 ms), high-jitter (2.97 ± 0.85 ms) polysynaptic EPSCs with 10 ms-long photostimulation of CGRP+ afferent terminals and, conversely, only a small fraction of Tacr1+ SPB neurons exhibited long-latency (14.29 ± 3.49 ms), high-jitter (4.31 ± 2.31 ms) polysynaptic EPSCs with 10 ms-long photostimulation of Mrgprb4+ afferent terminals. 2 out of 7 Tacr1+ SPB neurons exhibited long-latency (11.89 ± 4.18 ms), but relatively low-jitter (0.57 ± 0.21 ms) synaptic EPSCs following 10 ms-long photostimulation of Ntrk2+ afferent terminals. e, Representative traces of light-activated currents (left) and AP firing (right) upon photostimulation of Mrgprd+ primary afferent terminals. Turquoise bars, 0.1 ms (EPSCs) and 1 ms (APs) LED (473 nm) stimulations. f, Quantifications of peak current density. Mann-Whitney test (two-tailed); n = number of neurons. g, Schematic of injections of AAV2-retro-FlpO viruses into the PBNL. h, Distribution of tdTomato-expressing dendrites of Tacr1+ (top) and Gpr83+ (bottom) SPB neurons. Lamina IIid is labeled using IB4 binding. Arrowheads, Gpr83+ dendrites that are extended into deeper lamina of the spinal cord dorsal horn. i, Quantification of distance between the cell bodies and the outer boundary of IB4+ lamina IIid (dotted line). #, note that a small number of Gpr83+ SPB neurons have their cell bodies located within lamina IIid. n = 65, 60 neurons for Tacr1+, Gpr83+, respectively. j, k, Quantifications of total length of dendrites in a spinal cord section image within (j) or below (k) IB4+ lamina IIid (normalized to the total length of the IB4+ lamina IIid in the same spinal cord section image). Two-tailed t-test; n = 18, 23 sections (40 μm) for Tacr1+, Gpr83+, respectively. Error bars, s.e.m.
