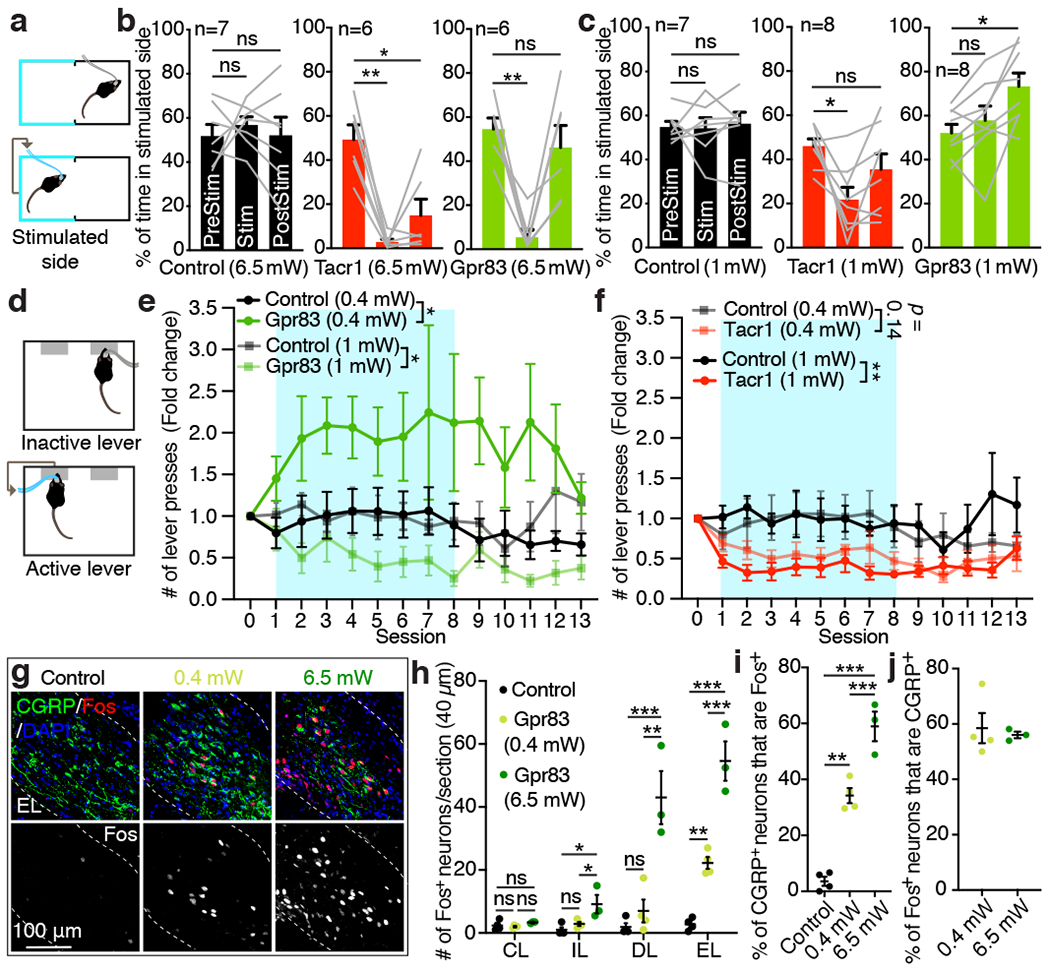
Figure 5. Activation of Tacr1- and Gpr83-expressing SPB neurons induces distinct affective behaviors in a stimulus intensity-dependent manner.

a, Schematic of the optogenetic stimulation-coupled real-time place preference assay. b, c, Quantifications of % of time spent in stimulated side for 6.5 mW (b) and 1 mW (c) photostimulations (10 Hz, 10 ms pulse width). One-way repeated measures ANOVA (Dunnett’s multiple comparisons test); F[1.626, 8.131] = 19.10 (Tacr1), F[1.580, 7.901] = 14.41 (Gpr83) (b); F[1.903, 13.32] = 7.20 (Tacr1), F[1.817, 12.72] = 8.42 (Gpr83) (c); n = number of mice. d, Schematic of the optogenetic stimulation-coupled lever-pressing assay. Mice received 5 second-long photostimulation (473 nm, 10 Hz, 10 ms pulse width) upon pressing an active lever. e, f, Fold changes of number of lever press are plotted over sessions. Turquoise boxes, 8 days of light-on sessions. n = 7 (control, 0.4 mW; Tacr1, 0.4 mW; Gpr83, 0.4 mW; Tacr1, 1 mW), n = 6 (control, 1 mW), n = 8 mice (Gpr83, 1 mW). Two-way repeated measures ANOVA; F[1, 12] = 5.26 (0.4 mW), F[1, 12] = 5.22 (1 mW) (e); F[1, 12] = 2.50 (0.4 mW), F[1, 11] = 10.14 (1 mW). g, Distribution of Fos+ neurons in the PBNEL following photostimulation of Gpr83+ SPB axon terminals. h-j, Quantifications of the number of Fos+ neurons in different PBNL subnuclei (h), % of CGRP+ neurons that are Fos+ (i), and % of Fos+ neurons that are CGRP+ (j). One-way ANOVA (Tukey’s multiple comparisons test); F[2, 8] = 7.41 (PBNIL), F[2, 8] = 22.03 (PBNDL), F[2, 8] = 64.36 (PBNEL); F[2, 8] = 74.94 (i); n = 4, 4, 3 mice for control, 0.4 mW, and 6.5 mW, respectively. Error bars, s.e.m.
