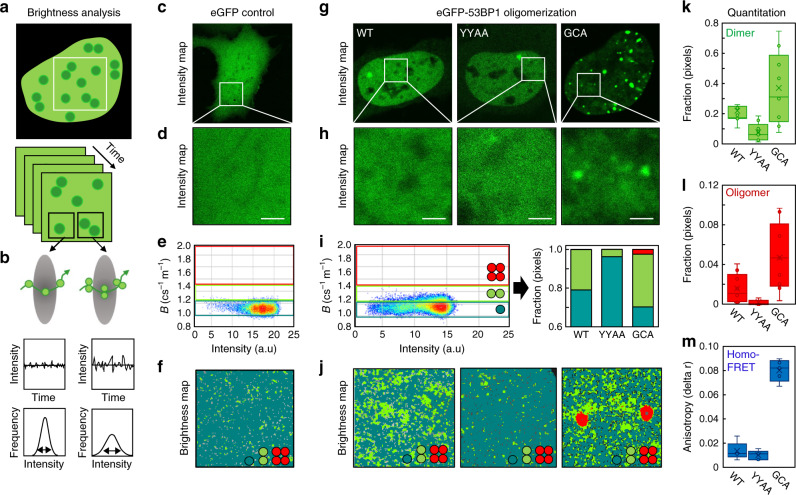
Fig. 1. NB analysis reveals 53BP1 to exist as a dimer throughout the nucleoplasm.
a Schematic of a Number and brightness (NB) frame scan acquisition to measure eGFP-53BP1 oligomerization in a live DIvA cell. b Schematic of how eGFP-53BP1 monomer vs. oligomer diffusion through a diffraction limited point spread function of a frame scan pixel gives rise to a fluorescence fluctuation exhibiting a low vs. high variance with respect to the mean (definition of apparent brightness and the parameter that reports the oligomeric state of eGFP-53BP1). c, d Intensity image of a DIvA cell expressing eGFP (monomer calibration) (c) and the region of interest (ROI) from which an NB data acquisition was recorded (d). e Intensity vs. brightness scatterplot of the NB data acquisition presented in d reports the monomeric brightness of eGFP and enables extrapolation of brightness windows to detect eGFP-53BP1 dimer and oligomer formation. f Brightness map of the eGFP NB data acquisition in d pseudo-colored according to the brightness windows defined in e. g, h Intensity images of a DIvA cell expressing eGFP-53BP1 (WT), eGFP-53BP1YY1258,1259AA (YYAA) and eGFP-GCA-53BP1(GCA) (g), and the ROI from which each NB data acquisition was recorded (h). i Intensity vs. brightness scatterplot of the eGFP-53BP1 NB data acquisition presented in h with the calibrated brightness windows superimposed (left) and quantification of the fractional contribution of 53BP1 monomer (teal), dimer (green), and oligomer (red) in WT vs. YYAA and GCA (right). j Brightness maps of the NB data acquisitions presented in h pseudo-colored according to the brightness windows defined in i spatially map 53BP1 monomer (teal), dimer (green), and oligomer (red) localization in WT vs. YYAA and GCA. k, l NB quantification of the fraction of eGFP-53BP1 dimer (k) vs. oligomer (l) present in WT vs. YYAA and GCA across multiple cells (N = 10 cells, two biological replicates). m Homo-FRET quantification of eGFP-53BP1 dimer and or oligomer formation in WT vs. YYAA and GCA across multiple cells (N = 5 cells, two biological replicates). Box and whisker plots in k–m show the minimum, maximum, sample median, and first vs. third quartiles. Scale bars, 2 μm.

