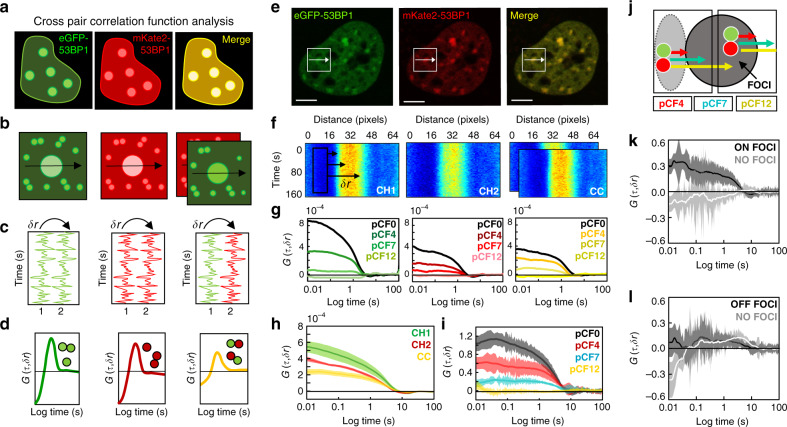
Fig. 3. Cross pCF analysis tracks 53BP1 dimer recruitment and retention at DSBs.
a, b. Schematic of how co-labeling 53BP1 with eGFP and mKate2 (a) alongside acquisition of a two-channel line scan (b) enables 53BP1 dimers to be tracked by cross-pair correlation function (pCF) analysis. c, d Schematic of how the fluorescence fluctuations that result (c) can be spatially cross-correlated within each channel to track eGFP-53BP1 vs. mKate2-53BP1 transport or spatially cross-correlated between two channels (d) to track eGFP-53BP1 molecules in complex with mKate2-53BP1. e Confocal image of a DIvA cell nucleus co-transfected with eGFP-53BP1 and mKate2-53BP1 that has been treated with 4OHT. f Intensity carpet of a two-channel line scan acquired across a 53BP1 foci from the cell selected in e, in the green (CH1), red (CH2), and cross-correlated channels (CC) (schematic of the first 10 pixels cross-correlated at δr = 0, 4, 7, and 12 pixels (i.e., pCF0, pCF4, pCF7, and pCF12) is superimposed over CH1). g Overlay of the pCF0, pCF4, pCF7, and pCF12 profiles derived in the green (CH1) vs. red (CH2) channels of the two-channel line scan presented in f and the corresponding cross-pCF profiles (yellow) (pCF0 = 80 nm (pixel diameter), pCF4 = 320 nm, pCF7 = 560 nm, and pCF12 = 980 nm). h Overlay of cross pCF0 analysis of 53BP1 dimer mobility (yellow) with pCF0 analysis of total 53BP1 mobility (green, red) to extract the fraction of 53BP1 dimer present in the nucleoplasm (N = 5 cells, shading indicates SEM). i Overlay of cross-pCF4, pCF7, and pCF12 analysis of 53BP1 dimer transport from the nucleoplasm onto a DSB foci normalized with respect to pCF0 to compare transit efficiency (N = 5 cells, shading indicates SEM). j Schematic of the spatial evolution of 53BP1 dimer transport onto vs. off a DSB foci (pCF7 reaches outside the point spread function). k, l Cross-pCF7 analysis of 53BP1 dimer translocation onto a DSB foci (k) vs. off this structure (l) that is normalized with respect to cross pCF0 (N = 5 cells, shading indicates SEM). Scale bars, 5 μm.

