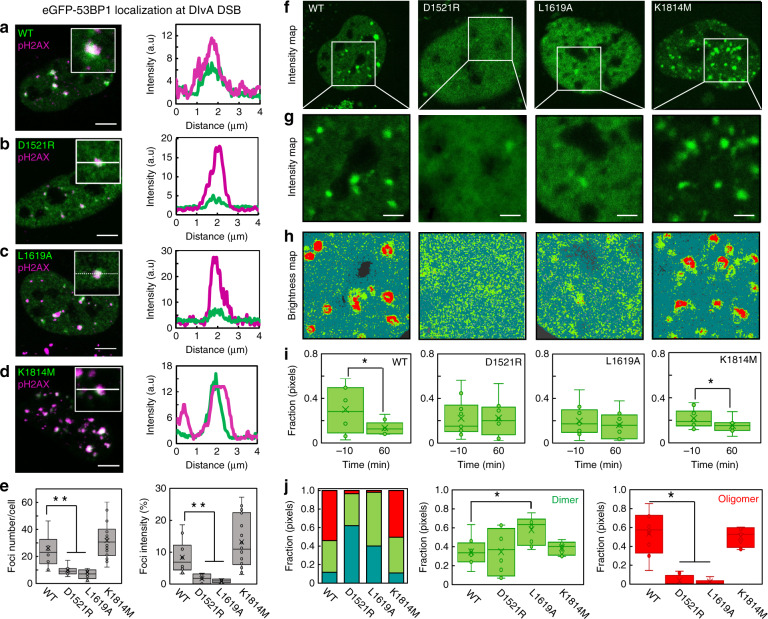
Fig. 4. The DSB histone code regulates a spatiotemporal redistribution in 53BP1 oligomerization.
a–d Co-localization of eGFP-53BP1 (WT) (a), eGFP-53BP1D1521R (D1521R) (b), eGFP-53BP1L1619A (L1619A) (c), and eGFP-53BP1K1814M (K1814M) (d) with γH2AX immunofluorescence in a single cell (left panels) and across a single-foci (right panels). Scale bars, 5 μm. e Quantification of foci number (left panel) and foci intensity (right panel) per cell at 60 min following 4OHT DSB induction (N > 30 cells). f, g Intensity images of a DIvA cell expressing WT, D1521R, L1619A, and K1814M at 60 min following 4OHT DSB induction (f) and the region of interest from which an NB frame scan acquisition was recorded in each case (g). Scale bars, 2 μm. h Brightness maps of the NB data acquisitions presented in f, g pseudo-colored according to the brightness windows defined in Fig. 1i. Corresponding intensity vs. brightness scatter plots are presented in Supplementary Fig. 6a, as well as additional NB FFS data acquired 60 min after 4OHT treatment of these different 53BP1 constructs (Supplementary Fig. 6b, c). i NB quantification of the fraction of WT, D1521R, L1619A, and K1814M dimer in the nucleoplasm before and 60 min after 4OHT induction of DNA DSBs (N = 10 cells, two biological replicates). j NB quantification of the fractional contribution of monomer, dimer, and oligomer in WT, D1521R, L1619A, and K1814M foci 60 min after 4OHT induction of DNA DSBs (left) (N = 10 cells, two biological experiments). Box and whisker plots in e, i, j show the minimum, maximum, sample median, and first vs. third quartiles. *P < 0.05, **P < 0.01 (unpaired t-test).

