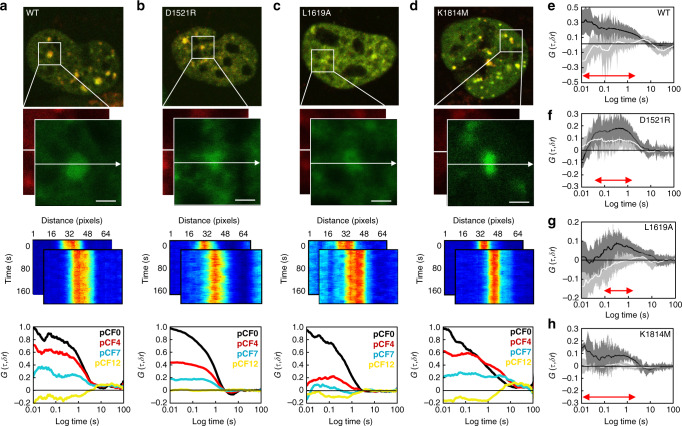
Fig. 5. The DSB histone code differentially regulates 53BP1 dimer transportation and retention onto a DSB.
a–d Two color merged confocal image of a DIvA cell nucleus co-transfected with eGFP and mKate2 tagged 53BP1 (WT) (a), 53BP1D1521R (D1521R) (b), 53BP1L1619A (L1619A) (c), and 53BP1K1814M (K1814M) (d), which has been treated with 4OHT for 60 min (top row) and the region of interest selected for acquisition of a two-channel line scan (second row). Intensity carpet of the two-channel line scan acquired across a selected 53BP1 WT, D1521R, L1619A and K1814M foci in the green and red channels (third row), as well as cross-pCF analysis of the spatial evolution of 53BP1 WT, D1521R, L1619A, and K1814M dimer transport onto this structure at a distance of δr = 0, 4, 7, and 12 pixels (i.e., pCF0, pCF4, pCF7, and pCF12) (bottom row). In agreement with cross-pCF analysis of 53BP1 WT in Fig. 3, cross-pCF7 was optimal for tracking D1521R, L1619A, and K1814M dimer translocation onto the DSB foci (cross-pCF4 tracks local mobility while pCF12 does not detect 53BP1 dimer translocation with significant efficiency). e–h Cross-pCF7 analysis of 53BP1 WT (e), D1521R (f), L1619A (g), and K1814M (h) dimer translocation onto a DSB foci (black) vs. off this nuclear structure (white) (N = 10 cells, two biological replicates). Shading indicates SEM and red arrows indicate in each case the distribution of time delays detected. All cross-pCF curves in a–d and e–h are normalized with respect to cross pCF0. Scale bars, 2 μm.

