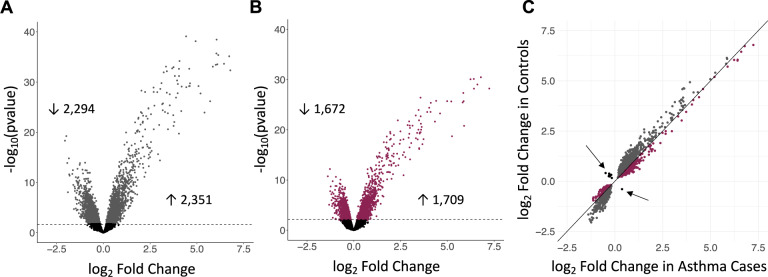
Fig. 1. Different transcriptional responses to RV in asthma cases and controls.
Volcano plots showing the log-fold transcriptional changes to RV (x-axis) in controls (A) and cases (B) at FDR < 0.05 (dashed horizontal line). C The log fold change in the 1929 genes that are differentially expressed in both cases (x-axis) and controls (y-axis). Gray points indicate genes with greater log fold change in controls; burgundy points indicate genes with greater log fold change in cases. Arrows point to black dots representing the thirteen genes with opposite direction of effect in cases and controls.

