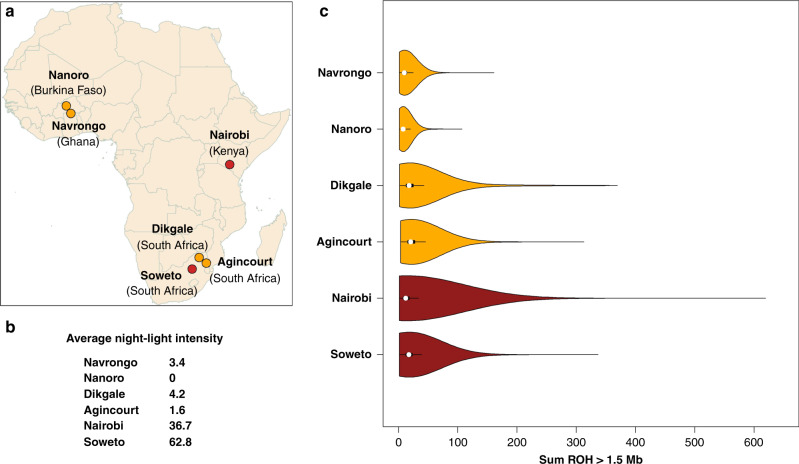
Fig. 1. Recruiting AWI-Gen study sites, night-light intensity and distribution of the sum of ROH (ROH > 1.5 Mb).
a Locations of the recruitment sites for the AWI-Gen study. Nanoro (Burkina Faso) N = 1,983; Navrongo (Ghana) N = 1,844; Nairobi (Kenya) N = 1,771; Dikgale (South Africa (S.A.)) N = 1,143; Agincourt (S.A.) N = 2,094; Soweto (S.A.) N = 1,782. b Economic and urban development is proxied by 2013 night-light intensity data made available by the National Geophysical Data Centre (NGDC) of the National Oceanic and Atmospheric Administration of the U.S. Night-light values range from 0 (unlit) to 63. Sites with average light-night intensity below and above 5 are colored orange and red respectively. c Violin plot showing the distribution of ROH longer than 1.5 Mb for each study site. Medians with the interquartile range (IQR) are shown in Supplementary Table 7.

