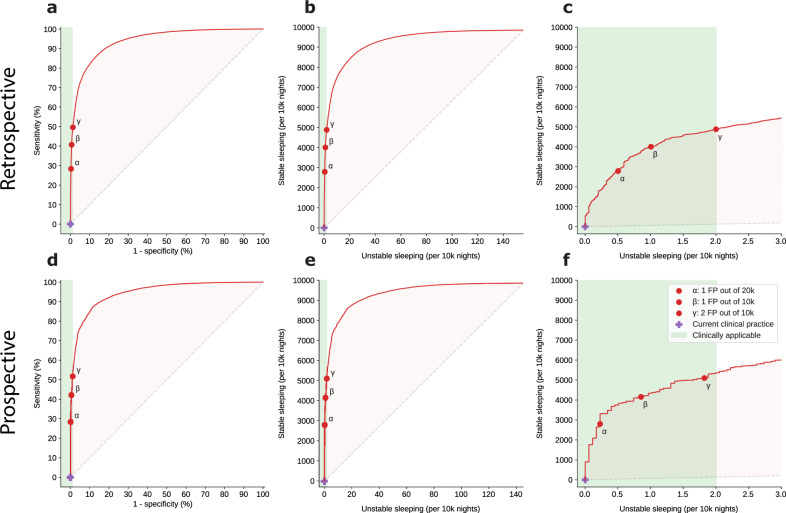
Fig. 3. Model performance illustrated by receiver operating characteristic (ROC) curves and clinically renormalized variants.
ROC curves for predicting overnight stability on the retrospective test (a) and prospective (b) datasets. The clinically renormalized variants for retrospective (b, c) and prospective (e, f) datasets show the balance between correctly letting stable patients sleep (Y-axis) and erroneously recommending sleep (predicted stable) to patients who ultimately had an elevated overnight risk score (X-axis), normalized to 10,000 patient-nights. The zoomed-in panels (c, f) highlight the clinically applicable range, which minimizes the number of false-positive predictions. The red points on all the curves (α, β, and γ) represent three different clinically applicable model thresholds, which were chosen according to the number of false positives they yielded for the retrospective test set. For example, threshold γ, the least conservative, maintains the number of unstable sleeping nights at the edge of acceptability, at 2 out of 10,000 patient-nights, while allowing approximately half of all patients to sleep safely (5000 out of 10,000 patient-nights). The blue cross on the bottom left of all panels indicates current practice, where all patients are woken for vital sign monitoring regardless of the risk level.

