Figure 4.

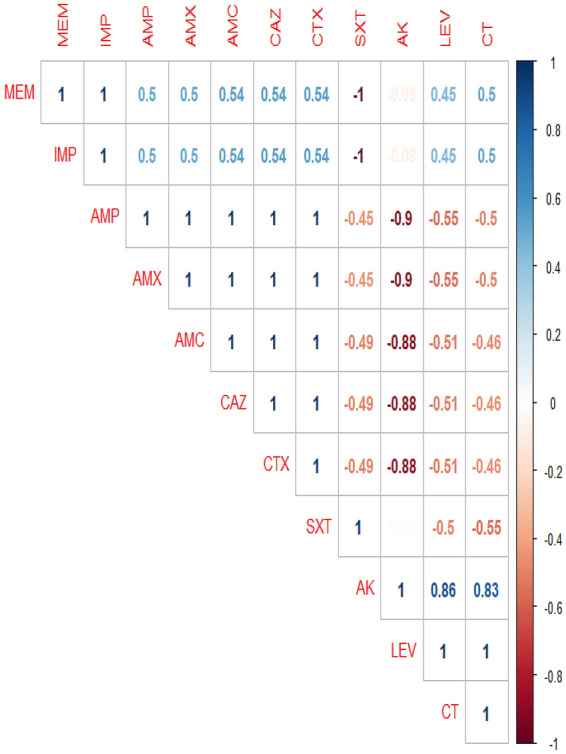
The correlation between the tested antimicrobial agents. The intensity of colors indicates the numerical value of the correlation coefficient (r), red, and blue color refers to the negative and positive correlations, respectively.

The correlation between the tested antimicrobial agents. The intensity of colors indicates the numerical value of the correlation coefficient (r), red, and blue color refers to the negative and positive correlations, respectively.