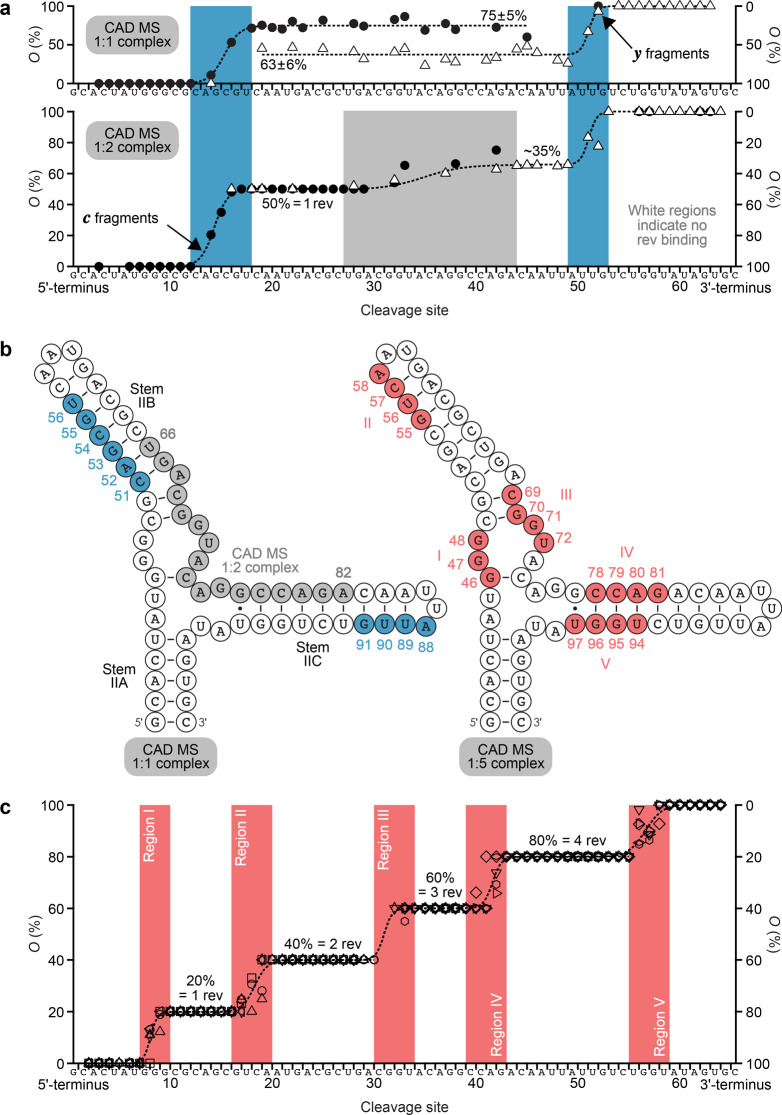
Fig. 6. Binding site mapping of RRE-II-0/rev complexes by CAD MS.
a Site-specific occupancies (O) of c (circles, left axis) and y (triangles, right axis) fragments with rev ARM peptide from CAD of 1:1 and 1:2 complex ions, (RRE-II-0 + 1·rev - 20H)20− and (RRE-II-0 + 2·rev - 20H)21−, at 200 eV and 241.5 eV, respectively, and b the corresponding binding regions (blue and gray) mapped onto the predicted secondary structure of RRE-II-0 (with additional hydrogen bonds between G46 and C74, and G77 and U97)27; c occupancies of fragments from CAD of 1:5 complex ions, (RRE-II-0 + 5·rev - nH)n−, for n = 18 at 387 eV (c: vertical lozenges, y: horizontal lozenges), n = 19 at 399 eV (c: leftward triangles, y: rightward triangles), n = 20 at 400 eV (c: circles, y: hexagons), n = 21 at 399 eV (c: squares, y: diamonds), n = 22 at 418 eV (c: upward triangles, y: downward triangles) for which source data are provided as a Source Data file, and the corresponding binding regions (red) mapped onto the RRE-II-0 structure (b).

