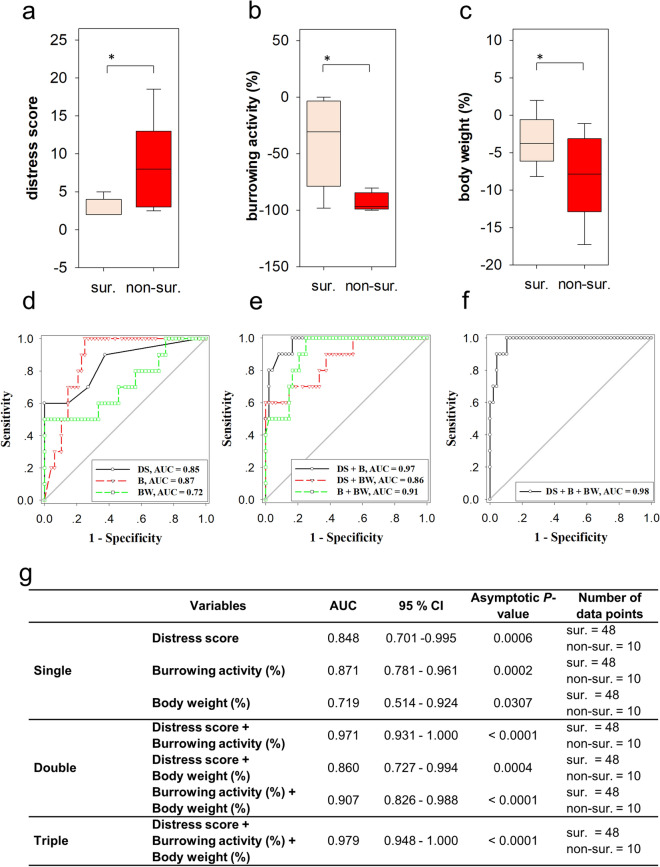
Figure 3.
Distress of survivors and non-survivors after BDL. The distress score (a) was increased (Mann–Whitney rank sum test, P ≤ 0.001), whereas burrowing activity (b) was decreased (Mann–Whitney rank sum test, P ≤ 0.001) and body weight (c) was also reduced (Mann–Whitney rank sum test, P = 0.031), when comparing data of survivors (sur.) to data of non-survivors (non-sur.). ROC curve analysis shows the area under the curve (AUC) for single (d), two (e) or all three (f) distress parameters. The performance of single and multiple parameters is described by presenting the AUC, the 95% confidence interval (CI) and the asymptotic P-value (g). Survivors: 16 mice, 48 data points; non-survivors: 10 mice, 10 data points.

