Figure 4.
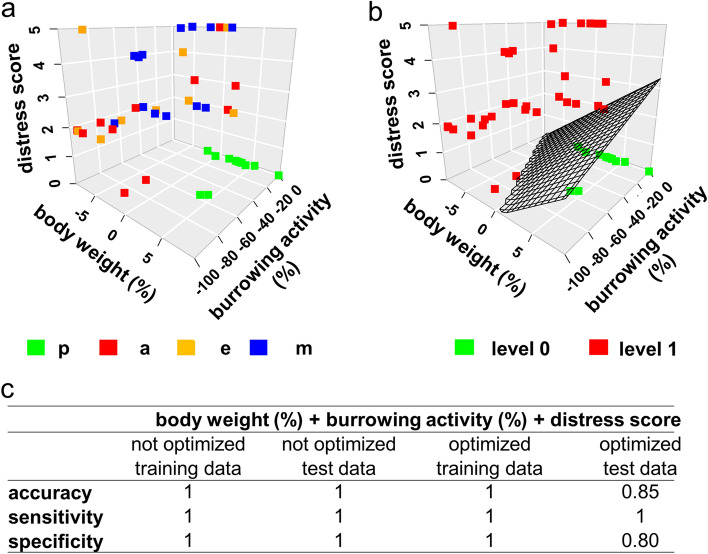
Generation of a training model by SVM. Single data points (squares), which were derived from the training data set from identical animal previous (p) to BDL and at the acute (a), early (e), and middle (m) phase of cholestasis are presented in form of a three dimensional scatter plot (a). A discriminatory model was built by training a linear SVM kernel to the labelled data in order to differentiate between two levels (level 0 and level 1) of distress (b): The resulting classifier (hyperplane) discriminates between these two levels. The accuracy, sensitivity and specificity of the training model was characterised using either the training data themselves or a test data set and applying the hyperplane (not optimized) or an optimized hyperplane after a 5-times repeated tenfold cross validation (c). Training data set: n = 11 data points (pre), post: n = 33 data points (post); test data set: n = 5 data points (pre), post: n = 15 data points (post).

