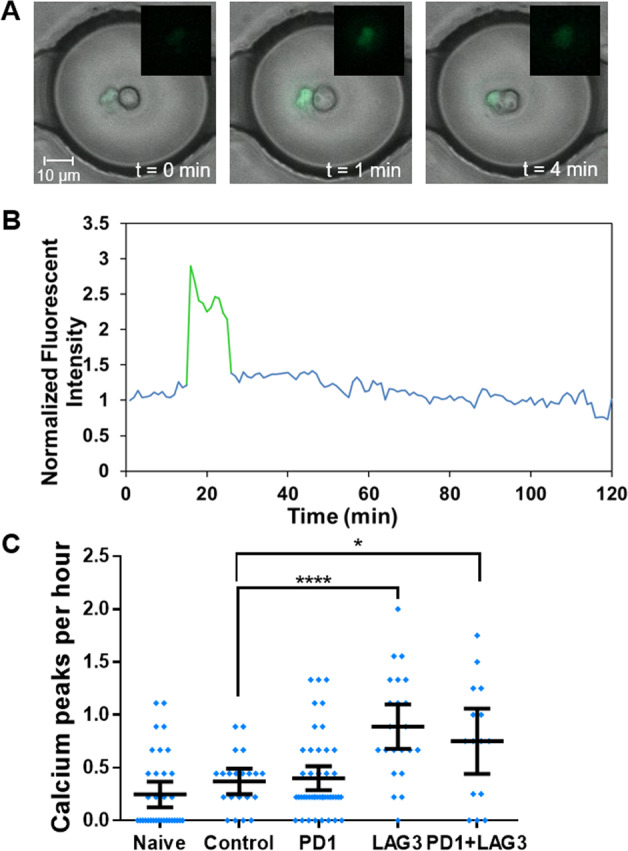
Fig. 3. Calcium levels of CD8+ T cells co-encaspulated with DCs.

A Overlay of fluorescent and merged phase images of a CD8+ T-cell co-encapsulated with a dendritic cell before and during a calcium peak. CD+ T cells are fluorescent and dendritic cells are unlabeled. B Representative normalized fluorescent intensity profile of a single cell displaying with calcium peak highlighted in green. C Average calcium peaks for each CD8+ T cells over 4.5 h. The sample sizes (n) for this experiment are: naive: 35, partially activated control: 21, PD1: 45, LAG3: 24, and PD1+ LAG3: 15 cells.
