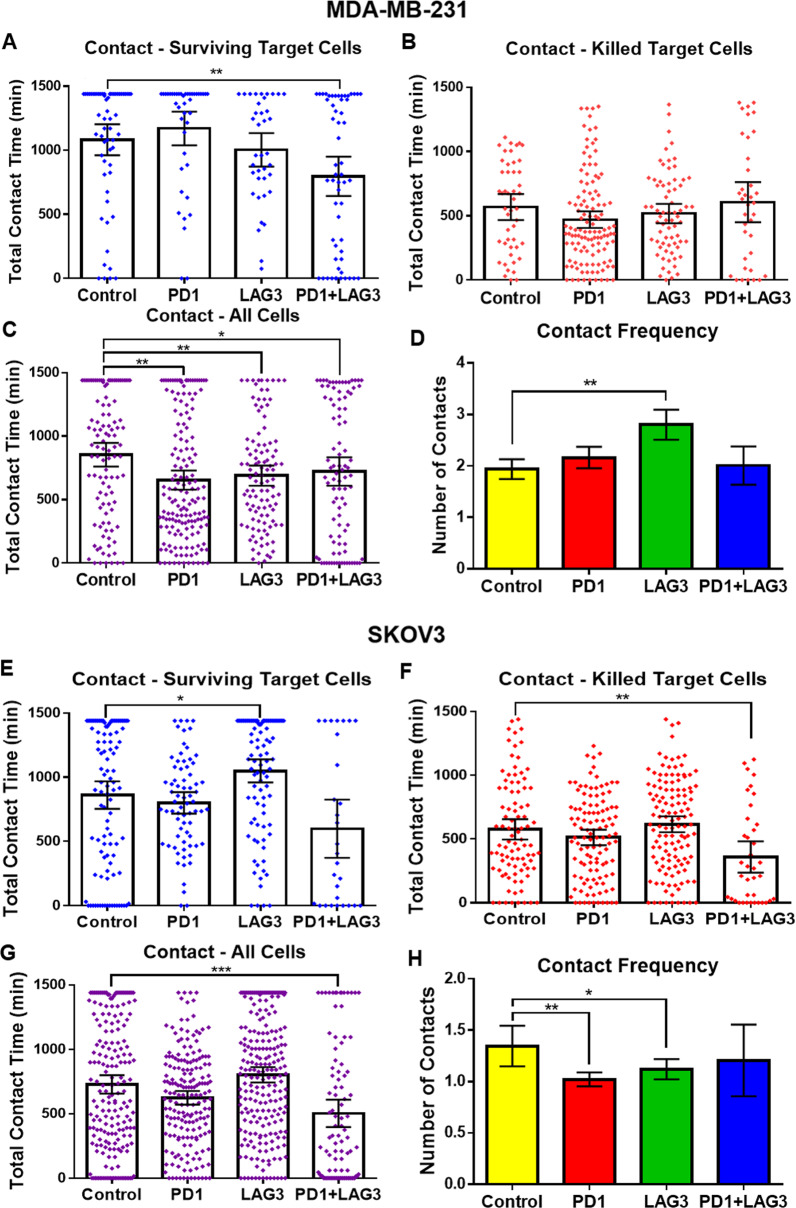
Fig. 5. Contact results of MDA-MB-231 and SKOV3 co-encapsulations with CD8+ T cells.
A–D Target cell is MDA-MB-231. A Total contact time between CD8+ T cells and target cells which survived 24 h in droplets. The total number of cells observed for each condition is Control: 60, PD1: 42, LAG3: 38, PD1++ LAG3: 57. B Total contact time between CD8+ T cells and target cells that in target cells died during imaging. The total number of cells observed for each condition is Control: 48, PD1: 118, LAG3: 70, PD1+ LAG3: 37. C Total contact time for all CD8+ T and target cell co-encapsulations (live and dead combined). D Average frequency of contact during 24-h experiments combined. N = Control: 327, PD1: 375, LAG3: 235, PD1+ LAG3: 142. E–H Target cell is SKOV3. E Total contact time between CD8+ T and target cells which survived 24 h in droplets. N = Control: 105, PD1: 72, LAG3: 96, PD1+ LAG3: 29. F Total contact time between CD8+ T cells and target cells that in target cells died during imaging. N = Control: 92, PD1: 113, LAG3: 127, PD1+ LAG3: 38. G Total contact time for all CD8+ T and target cell co-encapsulations (live and dead combined). N = Control: 197, PD1: 185, LAG3: 223, PD1+ LAG3: 96. H Average frequency of contact during 24-h experiments combined. N = Control: 197, PD1: 185, LAG3: 223, PD1+ LAG3: 96. Error bars represent the 95% confidence interval contact time for all conditions.

