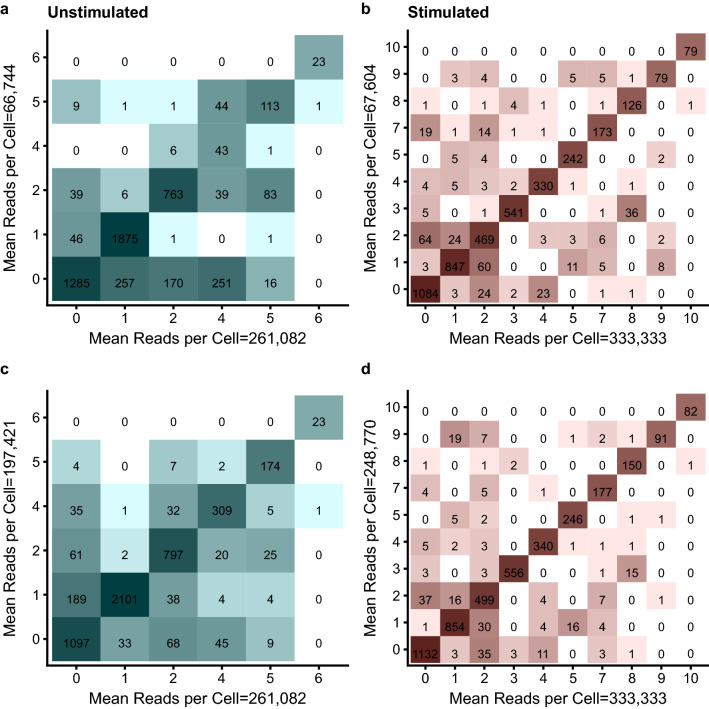
Figure 5.
Confusion matrices comparing cell type classification between full sequencing depth and low/high subsampled depths. Tiles are shaded and numbered according to the number of cells classified and diagonal tiles represent concordant cell type classification between depths. Unstimulated sample (a) 261,082 versus 66,744 reads per cell and (c) 261,082 versus 197,421 reads per cell. Stimulated sample (b) 333,333 versus 67,604 reads per cell and (d) 333,333 versus 248,770 reads per cell.

