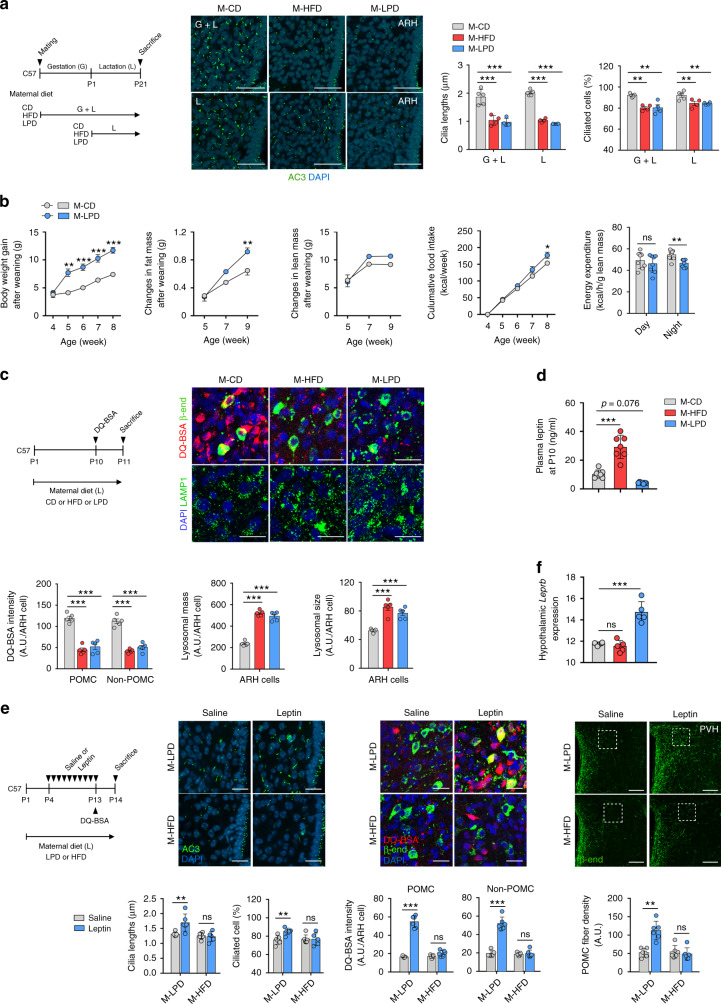
Fig. 10. Maternal malnutrition disrupts the leptin regulation of hypothalamic cilia–lysosome–neuronal circuit formation in neonatal mice.
a Hypothalamic cilia images in the neonatal offspring (at P14) of dams fed a high-fat diet (HFD) or low protein diet (LPD) during gestation and lactation or during lactation (n = 5 for M-CD, n = 4 for M-HFD and M-LPD). The average lengths of 100 ARH cilia per mouse are presented. Scale bars: 50 μm. b Changes in body weights, fat and lean mass, cumulated food intake, and energy expenditure (at 4 weeks) during the post-weaning period in the offspring of CD- or LPD-fed dams (n = 4 for food intake monitoring, n = 8 for other measurement). c DQ-BSA/β-END and LAMP1/DAPI double staining in the hypothalamic ARH of offspring of dams on a HFD or LPD (n = 5). The average values of 100 ARH cells per mouse are presented. Scale bars: 50 μm. d Plasma leptin concentrations in the offspring of CD-, HFD-, or LPD-fed dams during lactation at P10 (n = 7). e Hypothalamic cilia staining (AC3), lysosomal protein degradation (DQ-BSA/β-END staining) in the ARH, and POMC axonal projection in the PVH in the pups nourished by dams on a HFD or LPD and received either saline or leptin injections during P4–P13 (n = 5 for DQ-BSA study and n = 6 for all other analyses). Scale bars: 20 and 100 μm (axonal projections). f Hypothalamic leptin receptor (Leprb) mRNA expression in the offspring of CD-, LPD-, or HFD-fed dams at P14 (n = 6 for M-CD, n = 5 for the other 2 groups). Data values are presented as mean ± SEM. Statistics were performed using one-sided one-way ANOVA (a, c, d, f) and one-sided two-way ANOVA (b) followed by post hoc LSD test and two-sided Student’s t test (b—energy expenditure, e). *p < 0.05, **p < 0.01, and ***p < 0.001 between the indicated groups. ns not significant.

