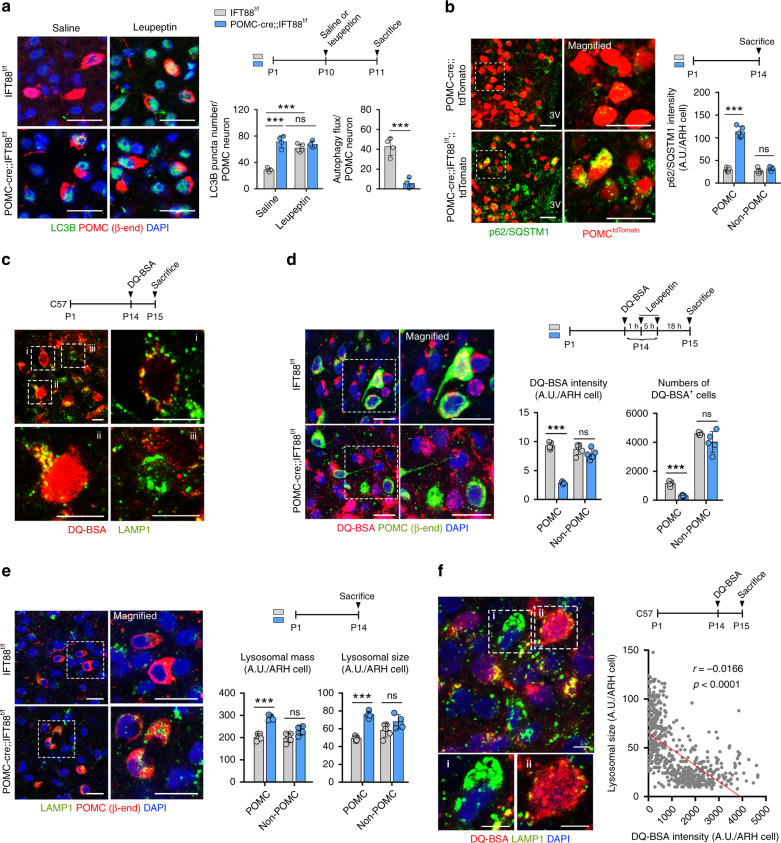
Fig. 6. Lysosomal dysfunction in the POMC neurons with defective ciliogenesis.
a LC3B (autophagy marker), β-endorphin (β-END), and DAPI staining for autophagy analysis in the ARH of POMC-cre;;IFT88f/f and IFT88f/f neonates at P11 (n = 5 for saline, n = 4 for leupeptin each genotype). Scale bars: 20 μm. b p62 (autophagy substrate) and tdTomato costaining in the ARH of POMC-cre;;IFT88f/f;;tdTomato and POMC-cre;;tdTomato neonates at P14 (n = 5). The graph depicts the average fluorescence intensity of p62 in 100 cells per mouse. Scale bars: 20 μm. c Double staining of DQ-BSA, indicative of lysosomal protein degradation, and LAMP1 in the ARH of C57 mice (n = 6). Magnified images of (i) ARH cell with DQ-BSA signals merged with lysosomes, (ii) cell with high-intensity lysosomal and extralysosomal DQ-BSA signals, and (iii) cell with lack of DQ-BSA signals. Scale bars: 10 μm. d Double staining of DQ-BSA and β-END in the ARH of POMC-cre;;IFT88f/f mice and IFT88f/f littermates (n = 5). The average DQ-BSA intensity values in 100 cells and the numbers of DQ-BSA+ cells in the ARH are presented. Scale bars: 20 μm. e LAMP1 and β-END double staining showing lysosomal mass and sizes in POMC and non-POMC ARH cells at P14 (n = 4 for POMC-cre;;IFT88f/f mice, n = 5 for IFT88f/f mice). The graph depicts the average values of LAMP1 intensity (lysosomal mass) and LAMP1+ puncta size (lysosomal size) in 100 cells per mouse. Scale bars: 20 μm. f Double immunostaining of DQ-BSA and LAMP1 in the ARH cells of C57 mice (n = 6). Magnified images of (i) ARH cell with larger lysosomes and lower DQ-BSA fluorescence intensity and (ii) cell with smaller lysosomes and higher DQ-BSA intensity. The graph depicts the correlation between the average lysosomal size and DQ-BSA intensity in ARH cells. Scale bar: 5 μm. Data values are presented as mean ± SEM. Statistics were performed using two-sided Student’s t test (a—autophagy flux, b, d, e), one-sided one-way ANOVA followed by post hoc LSD test (a—LC3 puncta), and linear regression analysis (f). ***p < 0.001 between groups. ns not significant.

