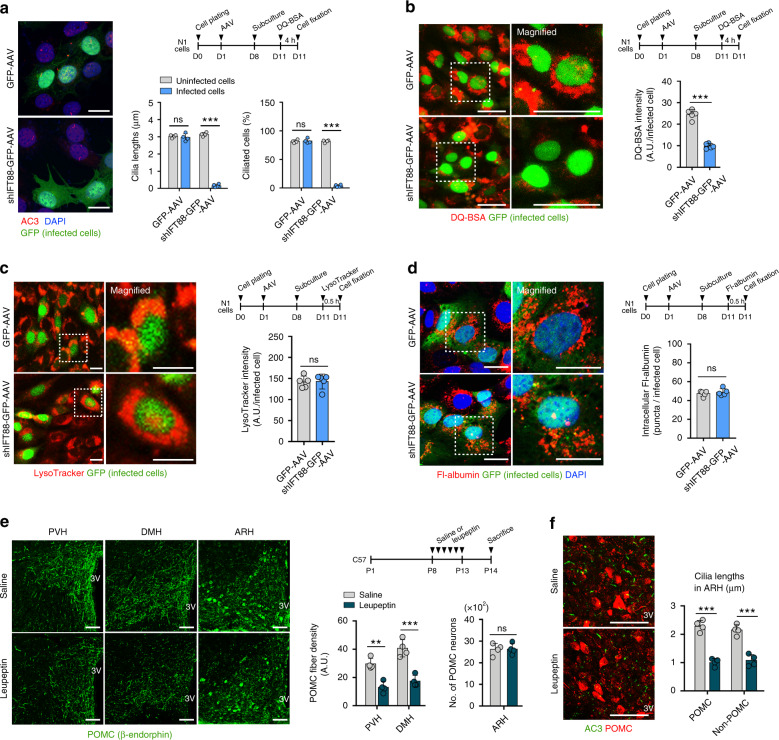
Fig. 7. Interplay among cilia, lysosomal protein degradation, and axonal projection in the hypothalamic neurons.
a Confirmation of ciliary dysgenesis in N1 hypothalamic neuron cells expressing IFT88 small hairpin RNA (shIFT88)-GFP. ARL13B (cilia marker), GFP, and DAPI staining in N1 cells transfected with shIFT88-GFP-expressing AAV (adeno-associated virus) or GFP-AAV (n = 4 wells). The average cilia lengths and ciliated cell percentages of about 50 infected cells and 50 uninfected cells are presented in each treatment group. Scale bars: 20 μm. b DQ-BSA intensity in N1 hypothalamic neuron cells infected with either shIFT88-GFP-AAV or GFP-AAV (n = 5 wells). The average DQ-BSA intensity of 50 GFP+ cells per well was presented. Scale bars: 20 μm. c Immunostaining of lysosomes using LysoTracker dye in N1 hypothalamic neuron cells (n = 5 wells). The average values of about 50 infected cells per well are presented. Scale bar: 10 μm. d Fluorescent-labeled albumin (Fl-albumin), GFP, and DAPI staining in N1 hypothalamic neuron cells transfected with shIFT88-GFP-AAV or GFP-AAV (n = 5 wells). The average numbers of Fl-albumin+ puncta in 50 GFP-expressing cells were measured per well. Scale bars: 20 μm. e β-END immunostaining in the hypothalamus of C57 neonates injected with saline or leupeptin during P8–P13 (n = 4). Scale bars: 100 μm. f POMC (β-END) and cilia (AC3) double immunostaining in neonates with saline or leupeptin injections (n = 4). Scale bars: 100 μm. Data are presented as mean ± SEM. Statistics were performed using two-sided Student’s t test (a–f). **p < 0.01 and ***p < 0.001 between groups. ns not significant.

