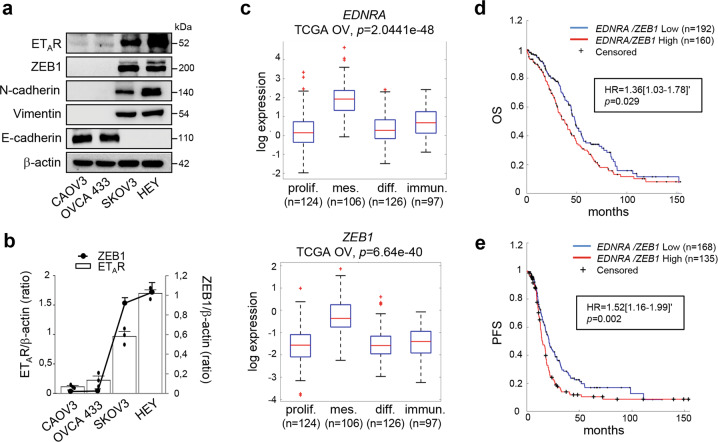
Fig. 1. The expression of ETAR/ZEB1 is upregulated in ovarian cancers and correlates with poor prognosis.
a Expression of ETAR, ZEB1, N-cadherin, Vimentin, and E-cadherin in ovarian cancer cell lines analyzed by Western blotting (WB). β-actin is used as loading control. b Correlation of the ETAR and ZEB1 expression in the indicated cell lines. The ratio of ETAR/β-actin and ZEB1/β-actin, evaluated by WB as shown in a, is presented as bar and line, respectively. Values are the mean ± SD (n = 3). c Boxplot diagrams of EDNRA (ETAR) and ZEB1 gene expression in HG-SOC patients from TCGA, subdivided in four molecular subtypes. d Kaplan–Meier curves of overall survival (OS) of 352 patients from TCGA grouped in high EDNRA/ZEB1 levels (160 patients, z-score > 1.5, red line) and low EDNRA/ZEB1 expression levels (192 patients, z-score < 1.5, blue line). e Kaplan–Meier curves of progression-free survival (PFS) of 303 patients from TCGA subdivided in high levels of EDNRA/ZEB1 expression (135 patients, z-score > 1.5, red line) and low levels of EDNRA/ZEB1 (168 patients, z-score < 1.5, blue line).

