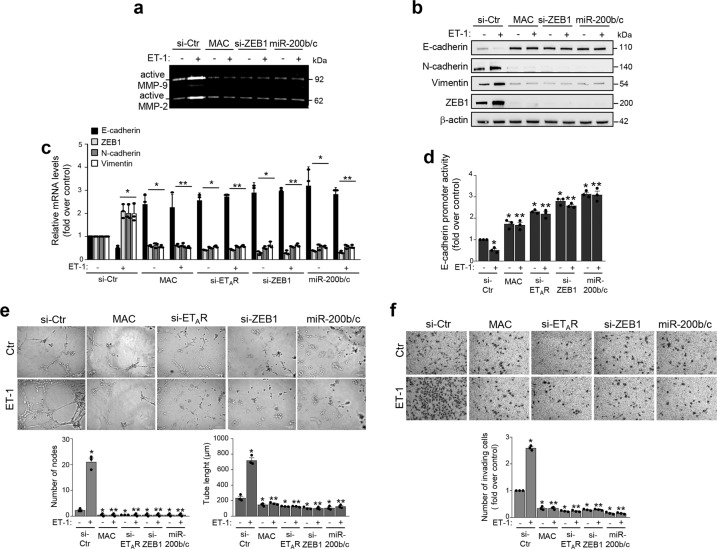
Fig. 6. The integrated circuit ETAR-miR-200b/c-ZEB1 is involved in ET-1-dependent protease activation, EMT, cell plasticity, and invasion.
a Conditioned media from SKOV3 cells transfected with siRNA control (si-Ctr), si-ZEB1, or mimic-miR-200b/c (miR-200b/c), or treated with MAC, stimulated or not with ET-1 for 48 h are analyzed by gelatin zymography to detect the active forms of MMP-2/9. b Expression of E-cadherin, N-cadherin, Vimentin, and ZEB1 proteins is analyzed by WB in SKOV3 cells transfected and stimulated as in a. β-actin is used as loading control. c E-cadherin, ZEB1, N-cadherin, and Vimentin gene expression in SKOV3 cells transfected with si-Ctr, si-ZEB1, si-ETAR, or mimic-miR-200b/c (miR-200b/c), and treated as in b is analyzed by qRT-PCR and normalized to cyclophilin-A. Values are the mean ± SD (n = 3; *p < 0.02 vs. si-Ctr; **p < 0.004 vs. ET-1 stimulated si-Ctr). d Luciferase activity in SKOV3 cells transfected as in c and co-transfected with the E-cadherin promoter reporter plasmid and stimulated with ET-1 and/or MAC for 48 h. Values are the mean ± SD expressed as fold induction (n = 3; *p < 0.002 vs. si-Ctr; **p < 0.004 vs. ET-1 stimulated si-Ctr). e Assay of tubule-like structure formation in SKOV3 cells transfected for 48 h as in c and overnight stimulated or not with ET-1. Original magnification 20×. (Scale bar: 100 μm). Graphs represent the quantification of the number of nodes and the tube length. Columns show the mean ± SD (n = 3; *p < 0.02 vs. unstimulated Ctr; **p < 0.001 vs. ET-1-stimulated Ctr). f Chemoinvasion assay in SKOV3 cells transfected as in c and overnight stimulated or not with ET-1. Images represent the crystal violet-stained invasive cells. Magnification ×10. Graph represents the number of invading cells. Columns show the mean ± SD (n = 3; *p < 0.001 vs. unstimulated Ctr; **p < 0.001 vs. ET-1-stimulated Ctr).

