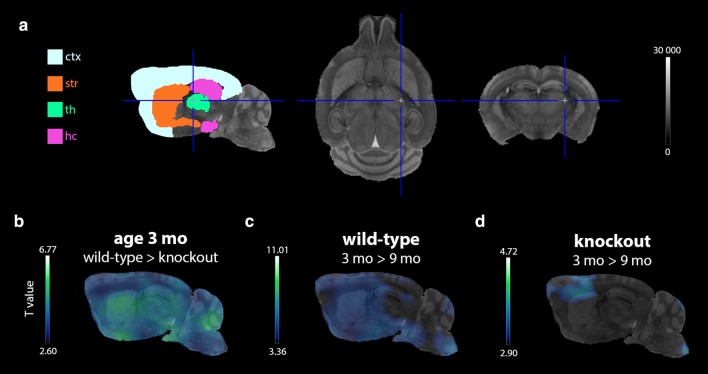
Fig. 3.
The results of the voxel-based statistical parametric mapping analysis of the [11C]UCB-J VT(IDIF) maps. a A representation of all analysed brain regions on a corresponding MR template. b Hypo T-map showing all voxel clusters (threshold: 100 voxels) with a significantly (p < 0.01) lower VT(IDIF) in ko compared to wt mice at the age of 3 mo. c Hypo T-maps indicating all voxel clusters (threshold: 100 voxels) that significantly (p < 0.01) declined over time in wt mice. d Similar hypo T-maps as in panel c for the ko mice (ctx = cortex; hc = hippocampus; ko = knockout; mo = months; MR = magnetic resonance; str = striatum; th = thalamus; wt = wildtype)

