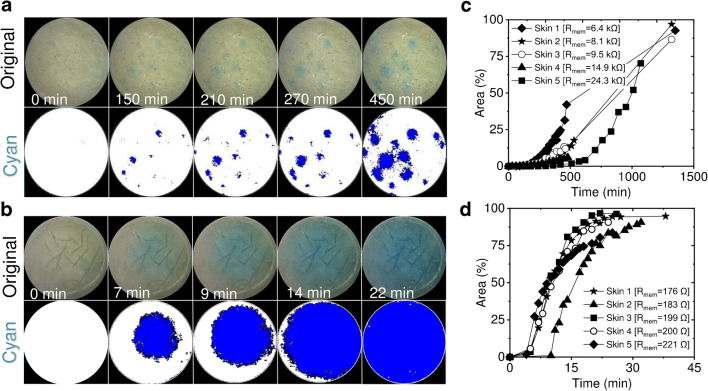
Fig. 2.
Visualisation of H2O2 skin membrane penetration by imaging the development of blue colour in the PW particle layer situated on the SC side of the skin membrane. The original photographic and corresponding cyan images are presented at certain time points after initiation of H2O2 penetration. Time 0 corresponds to the moment when the concentration of H2O2 in the lower Franz cell chamber was raised to 4 mM. Images taken for a unprocessed/natural skin membrane and b skin membrane after lipid extraction. The blue colour development is due to skin penetration of H2O2 and conversion of PW to PB (reaction Eq. 1). The images are taken by USB microscope. c, d Area % vs. time plots reflect an increase of the blue colour fraction with time due to PW conversion to PB on skin for cases of c unprocessed and d lipid-extracted skin, respectively. 100% area corresponds to the geometric area of the skin membrane since the entire surface became blue at the end of the experiment

