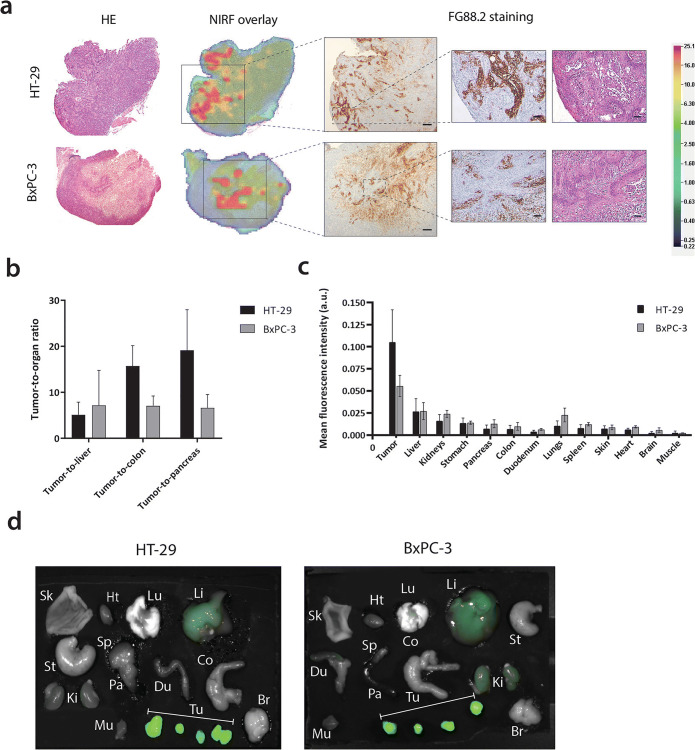
Fig. 6.
a Representative examples of ex vivo hematoxylin-eosin (HE) staining, NIR fluorescence heatmap (800 nm), and FG88.2 staining on HT-29 and BxPC-3 tumor tissue sections. Overview images are taken at × 25 magnification and inserts at × 100 magnification. Scale bars represent 500 μm and 100 μm for overview and insert images, respectively. b Average tumor-to-liver, tumor-to-colon, and tumor-to-pancreas ratios in HT-29 and BxPC-3 tumor-bearing mice at 168 h/1 week post-injection. c Biodistribution of CH88.2-800CW at 168h/1week post-injection expressed as tumor or organ MFI. d Ex vivo fluorescent images of resected tumors and organs. Sk, skin; Hrt, heart; Lu, lungs; Li, liver; St, stomach; Sp, spleen; Pa, pancreas; Du, duodenum; Co, colon; Ki, kidneys; Mu, muscle; Tu, tumors (under brackets); Br, brain.

