Fig. 1.
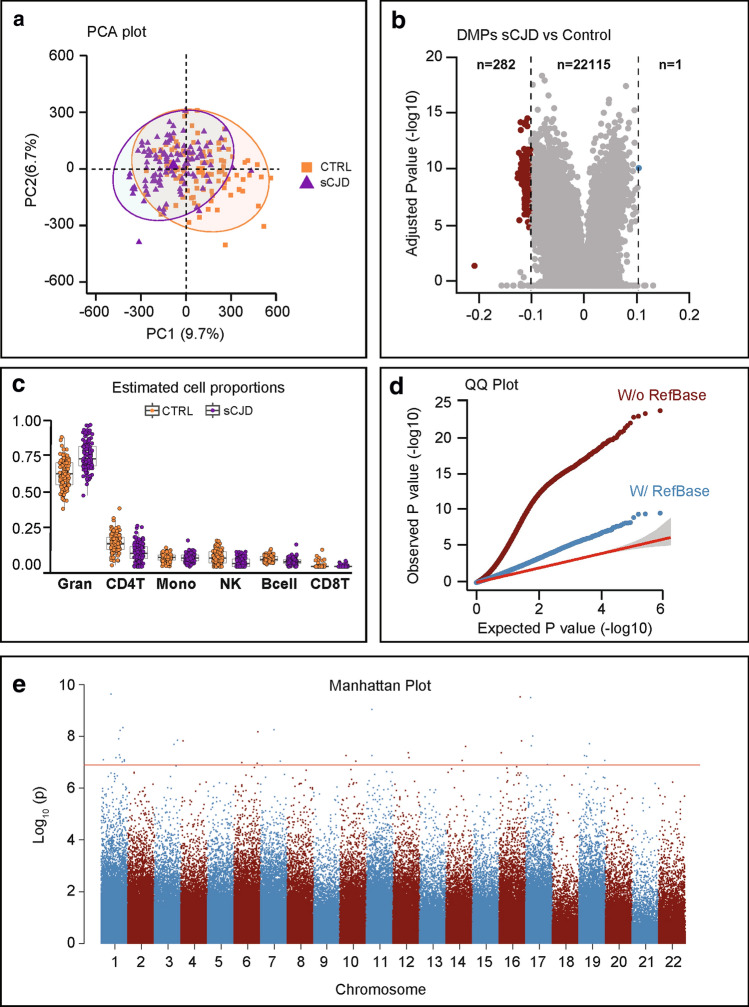
Genome-wide differential methylation in sporadic CJD blood. a Principal component analysis (PCA) of 219 DNA methylation profiles showing the first (PC1) and second (PC2) principal components (9.7% and 6.7% of the total variance). 95% confidence ellipses are drawn around the two groups: sCJD (triangles, purple) and healthy controls (squares, orange). b Volcano plot DMP association analysis (X and Y chromosomes were excluded from analysis), corrected for sex but not for blood cell composition. X-axis represents (effect size) adjusted mean delta difference, Y-axis represents − log10 (q value). Vertical lines indicate delta beta >|0.1|. c Tukey box plots showing proportions of six different cell types as estimated by Houseman algorithm in sCJD (purple) and healthy controls (orange). Wilcoxon–Mann–Whitney test to identify differences between sCJD and control: granulocytes p = 1.47e−14; CD4T p = 5.05e−11; monocytes p = 0.78; natural killers cells p = 1.10e−08; B cell p = 1.55e−10; CD8T p = 0.59. d Quantile–quantile plots (QQ plots) of the distribution of observed − log10 association p values against the expected null distribution without (dark red) and with (blue) cell type correction. The red line represents the expected distribution with 95% confidence interval. e Manhattan plot of probes associated with disease status corrected for blood cell type composition. Red line indicates significance threshold (Bonferroni-adjusted = 1.24 × 10⁻⁷). X-axis represents ranked chromosomes, Y-axis represents − log10 (p value)

