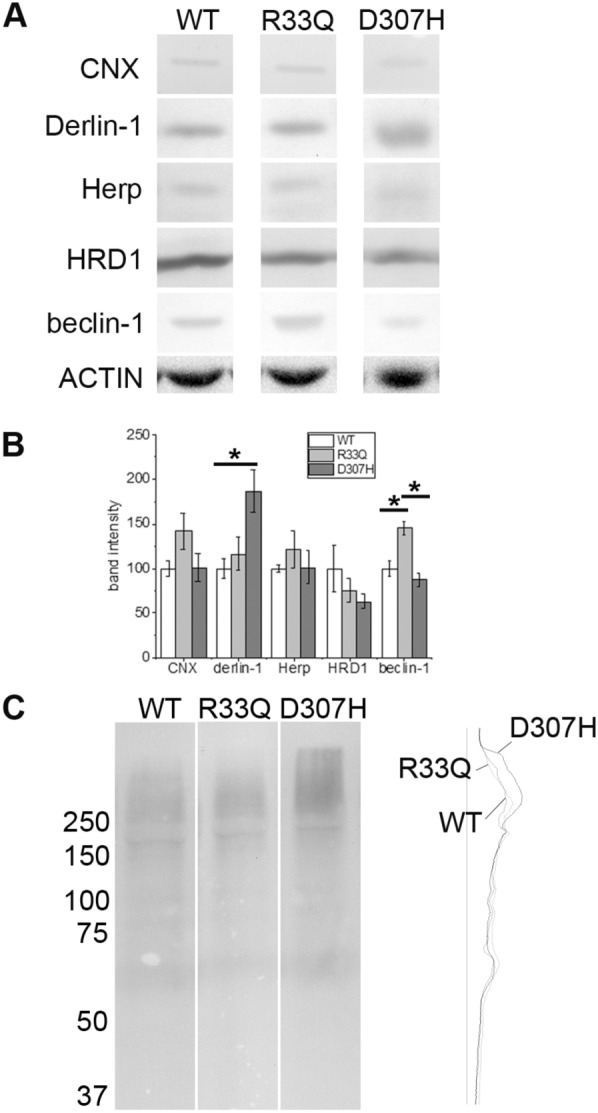
Fig. 2.

Expression of degradative pathway markers. a Relative protein expression of CNX, Derlin-1, Herp, HRD1, Beclin-1 and actin detected by Western Blot analysis in WT, R33Q KI and D307H KI hearts. b Average percentages are given as mean ± SE (n = 04) and they are compared to WT expressed as 100% ± SE. Asterisks (*) indicate a p < 0.05 as determined by one-way ANOVA Bonferroni’s test. Blots are representative images of each group and each experiment was repeated at least thrice. c Total mono- and poly-ubiquitinated conjugated proteins in WT, R33Q KI and D307H KI hearts detected by Western Blot and on the right, the densitometric profile of the same signal intensities (arbitrary OD) obtained through Scion Image software
