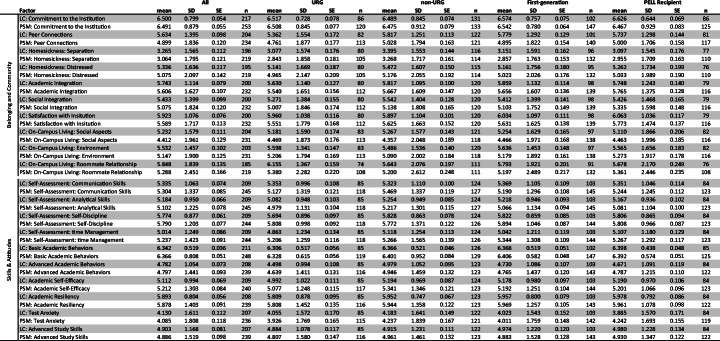
Table 3.
Students’ self-reported sense of belonging, community, academic skills and behaviors, as indicated by responses to Skyfactor Mapworks surveys
Results are provided for 20 factors each of which is comprised of 2–4 questions on an ordinal likert-scale of 1 to 7. Larger value indicator more favorable responses (i.e., high scores indicate strong sense of belonging, low feelings of homesickness, etc.). Means ±1 S.D. for all students and disaggregated student groups are provided, both for students in the learning community (LC; gray rows) and in the propensity score matched reference group (PSM; white rows)

