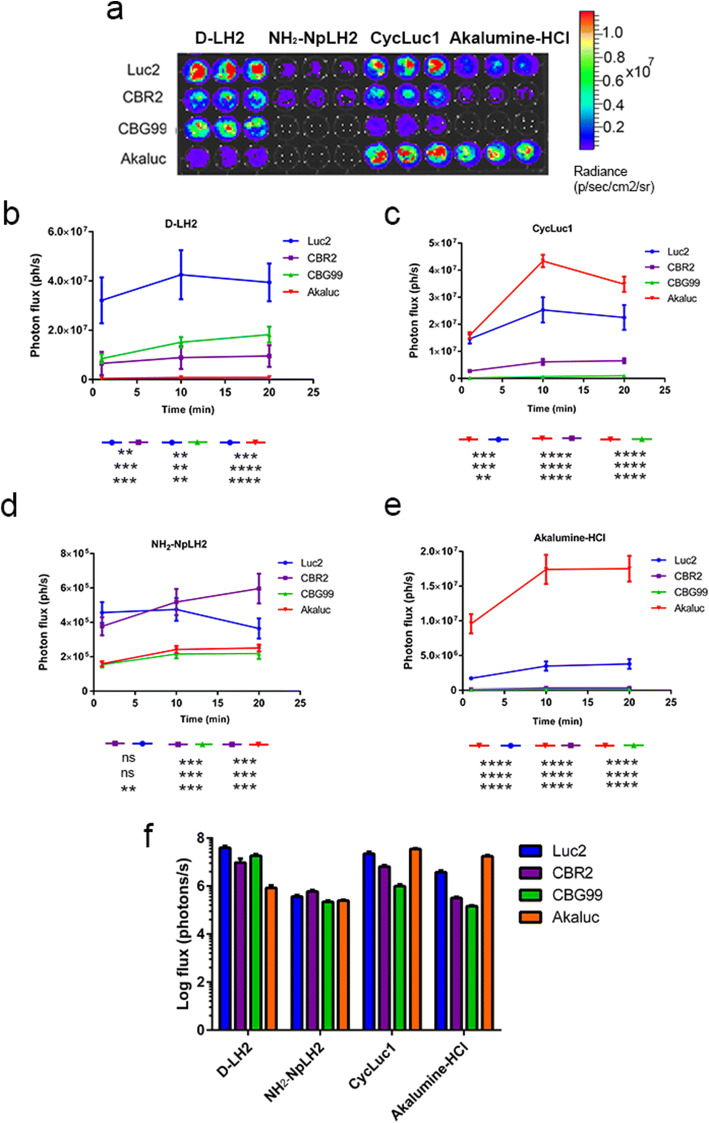
Fig. 1.
(a) Bioluminescence profiles for Luc2, CBR2, CBG99, and Akaluc luciferases combined with four different luciferin analogues in live cells. (b-f) Photon flux (ph/s) in HEK 293T cells expressing individual luciferases upon addition of substrates (0.1 mM) was quantified using an exposure time of 30 s. Statistical analysis (N = 3) was performed using one-way ANOVA followed by Tukey’s T test (*p < 0.01 for Luc2/d-LH2 compared with all combinations with the exception of Akaluc/Cycluc1 which was not significantly different).

