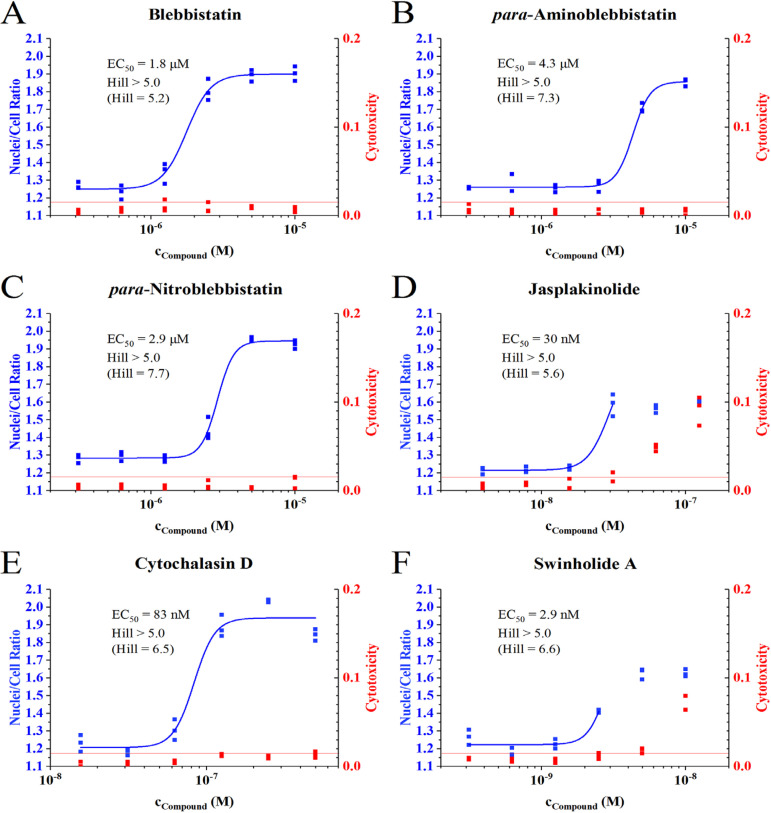
Figure 5.
Determination of compound potency and cytotoxicity. Representative dose-response curves showing raw data for blebbistatin (A), para-aminoblebbistatin (B), para-nitroblebbistatin (C), jasplakinolide (D), cytochalasin D (E) and swinholide A (F). Only cells overlapping with nuclei and nuclei overlapping with cells were counted to calculate the primary signal (NCR). Cytotoxicity is calculated as the ratio of dead nuclei to total nuclei. (Here, “total nuclei” is the sum of Hoechst33342 and PI double-positive nuclei and Hoechst33342-positive nuclei overlapping with living cells.) The primary signal was analyzed by fitting the experimental data to the Hill equation. Data points where the associated cytotoxicity signal was above the empirical threshold of 0.015 (red horizontal line, representing a dead nuclei ratio of 1.5%) were disregarded during the fitting process. This threshold usually represents levels of cell death that affect the primary signal (see 10 and 5 nM swinholide A, or 125 and 62.5 nM jasplakinolide as examples). In these cases, it was necessary to assume that the NCRmax parameter is equal to the signal of positive control and keep it fixed during the fitting process. In some cases, it might also be necessary to fix the Hill constant to get a reasonable fit. Due to the steep transition of the transition curves, the Hill constant is not well-constrained by the data. Therefore, only a lower limit (~5) can be estimated and reported (the best-fit values are shown in parentheses).

