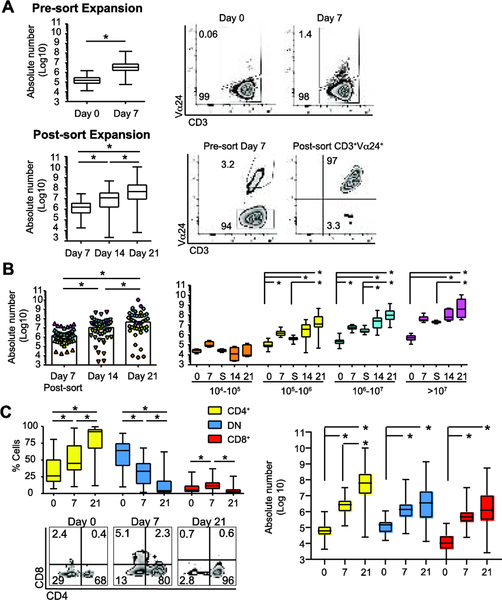
Figure 1: Ex vivo expansion results in CD3+Vα24+Vβ11+, predominantly CD4+ iNKT cells.
(A) Median and IQR ± range absolute number CD3+Vα24+ iNKT cells at day 0 and day 7 (N = 47) (left upper panel) and representative flow plots of CD3 and Vα24 expression (right upper panel). Median and IQR ± range absolute number CD3+Vα24+ iNKT cells after day 7 sort, including days 14, and 21 (N = 47) (left lower panel) with representative flow plots showing CD3 and Vα24 expression pre- and post-sort on gated CD3+ cells on day 7 (right lower panel).
(B) Left panel, median absolute number CD3+Vα24+ iNKT cells at day 7, day 14, and day 21 stratified by day 7 sort yield categories 104-105 (orange, N = 4), 105-106 (yellow, N = 16), 106-107 (cyan, N =21), and >107 (magenta, N = 6). Right panel, sub analysis of expansion data by day 7 sort categories showing median and IQR ± range absolute number CD3+Vα24+ iNKT cells at specified time points in the expansion protocol (S, day 7 post-sort).
(C) Median and IQR ± range percentage (left panel) with representative flow plots of CD4 and CD8 expression in gated CD3+Vα24+ cells on days 0, 7, and 21 (N = 36). Median and IQR ± range absolute number of CD4+, DN, and CD8+ CD3+Vα24+ iNKT cells on days 0, 7, and 21 (left panel; N = 36). P < 0.05 is represented by *.

