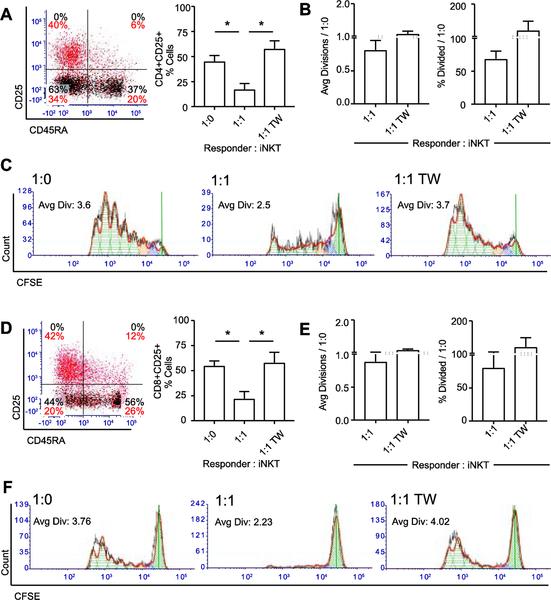
Figure 7: Expanded iNKT cells suppress activated CD4+ and CD8+ responder T cells in a contact-dependent manner.
(A) Left panel, representative CD25 and CD45RA expression on gated CD4+ CFSE+ responder cells stimulated for 5 days. Black, unloaded bead stim; red, anti-CD2/CD3/CD28-loaded bead stim. Right panel, mean ± SEM percentage gated CD25+ activated cells among CD4+ responder cells (N = 4). Responder : iNKT cell ratios: 1:0, responders alone; 1:1, responders with iNKT cells in direct contact at 1:1; 1:1 TW, responders and iNKT cells at 1:1 but separated by transwell.
(B) Average divisions (left panel) and % Divided (right panel) for gated CFSE+CD4+CD25+ responder cells (N = 4) cultured with expanded iNKT cells, normalized to CD2/CD3/CD28-stimulated responders alone. Dashed line represents responders alone.
(C) Representative proliferation of CFSE+CD4+CD25+ responder cells. Green cross-hatch, generation 0; blue, generation 1; orange, generation 2. TW, representative proliferation plot with iNKT cells separated from responders via transwell.
(D) Left panel, representative CD25 and CD45RA expression on control CD8+ gated CFSE+ responder cells stimulated for 5 days. Black, unloaded bead stim; red, anti-CD2/CD3/CD28-loaded bead stim. Right panel, mean ± SEM percentage gated CD25+ activated cells among CD8+ responder cells (N = 4). Responder : iNKT cell ratios: 1:0, responders alone; 1:1, responders with iNKT cells in direct contact at 1:1; 1:1 TW, responders and iNKT cells at 1:1 but separated by transwell.
(E) Average divisions (left panel) and % Divided (right panel) for gated CFSE+CD8+CD25+ responder cells (N = 4) cultured with expanded iNKT cells, normalized to CD2/CD3/CD28-stimulated responders alone. Dashed line represents responders alone.
(F) Representative proliferation of CFSE+CD8+CD25+ responder cells. TW, representative proliferation plot with iNKT cells separated from responders via transwell. P < 0.05 is represented by *.

