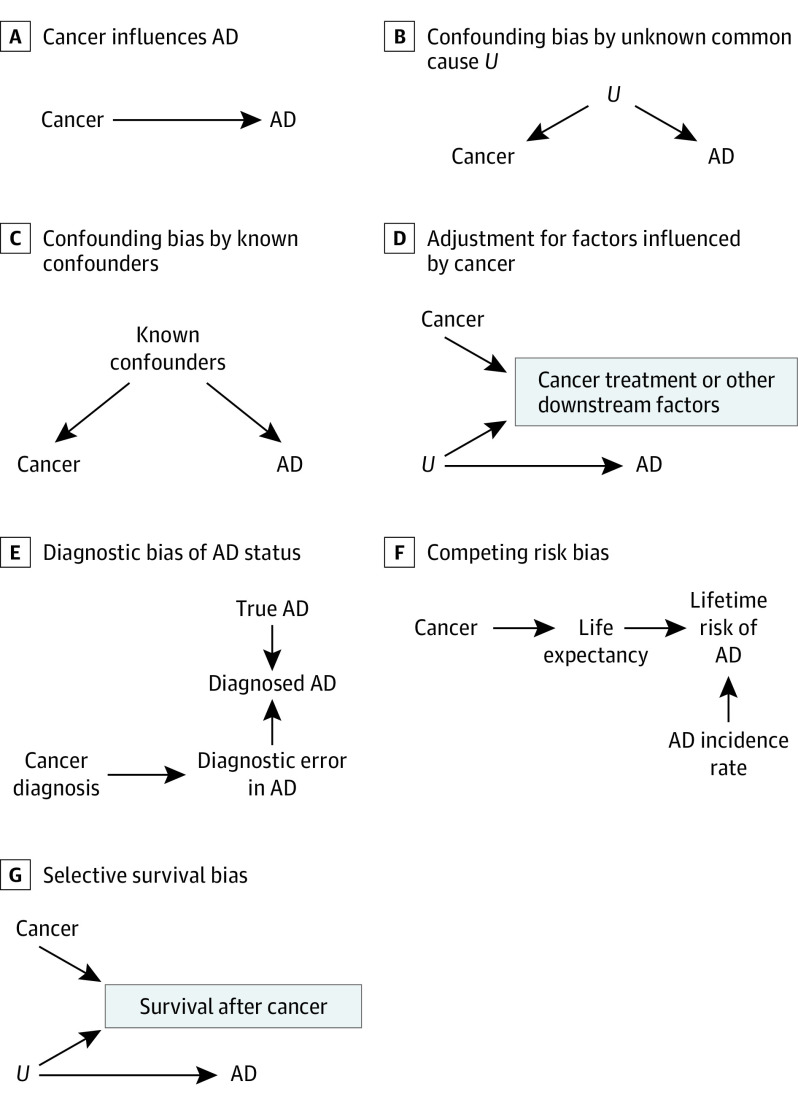
Figure 1. Directed Acyclic Graphs Depicting Alternative Explanations for the Observed Cancer–Alzheimer Disease (AD) Association.
The panel headings A through G correspond to the scenarios depicted in each panel. The directed acyclic graphs presented in panels A through G represent assumed data structures that could lead to spurious observed associations between cancer and AD. A, The direct arrow from cancer to AD indicates a causal association between cancer and subsequent AD risk. B, The direct arrows from unknown confounders U to cancer and to AD indicate that these conditions share a common cause. C-G, Alternative (noncausal) explanations for the cancer-AD association with no meaningful contribution of cancer to the etiology of neurodegeneration. C, The missing box around “Known confounders” indicates lack of statistical control for known confounders of the cancer-AD association. D, Adjustment for downstream variables, such as cancer treatment and comorbidities after cancer, is always inappropriate because it can introduce bias. E, A history of cancer diagnosis may influence the probability of receiving a diagnosis of AD. F, Cancer reduces life expectancy, and death is a competing risk to AD diagnosis. G, An unmeasured factor U promotes survival after cancer and reduces risk of AD. (The box around “Survival after cancer” indicates the restriction of the study population to those who survived cancer.)

