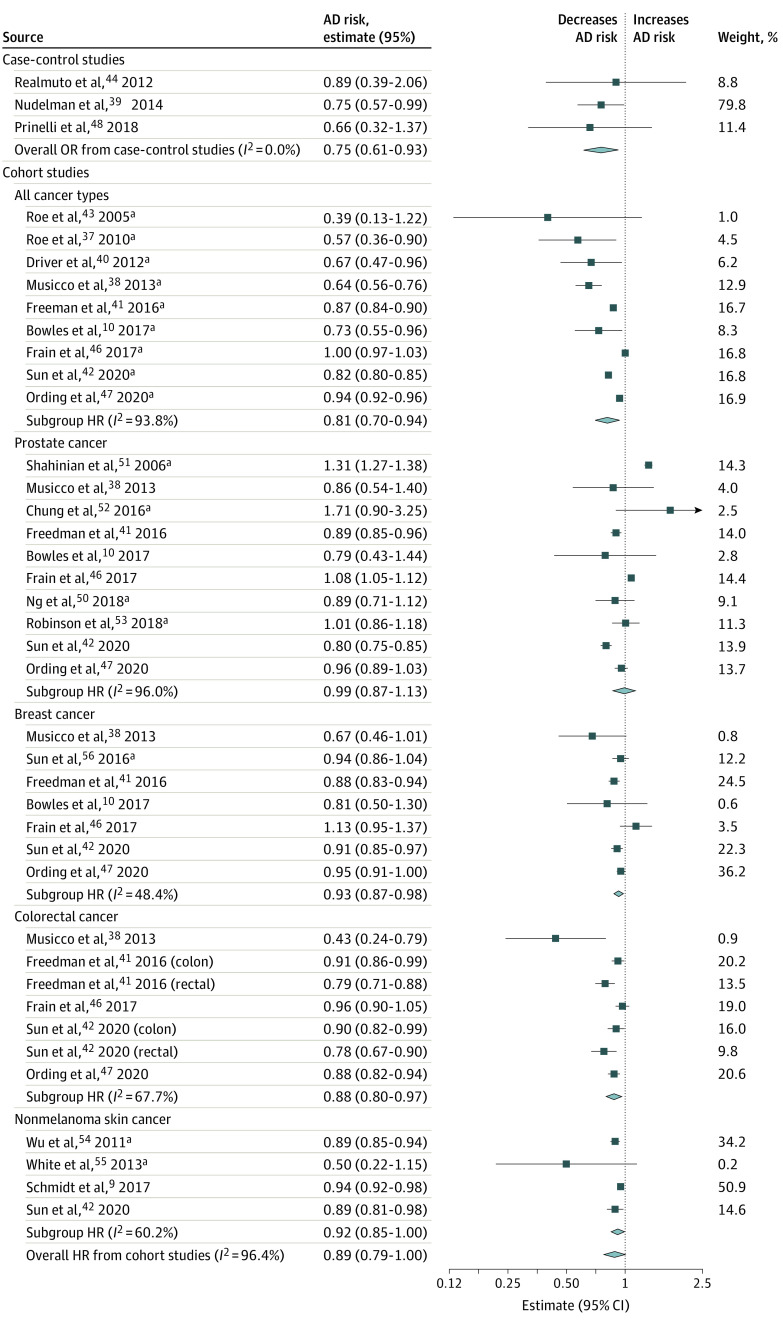
Figure 2. Forest Plot of Random-Effects Models for the Pooled Cancer–Alzheimer Disease (AD) Risk Estimatesa.
Random-effects meta-analyses were stratified by cancer type and study design. HR indicates hazard ratio; OR, odds ratio. Solid squares represent individual study estimates. The diamonds represent pooled estimates from the random-effects models.
aThe random-effects meta-analysis for cohort studies (16 studies) includes only the main study results to avoid double counting study participants when cancer type-specific subgroup analyses were performed.

