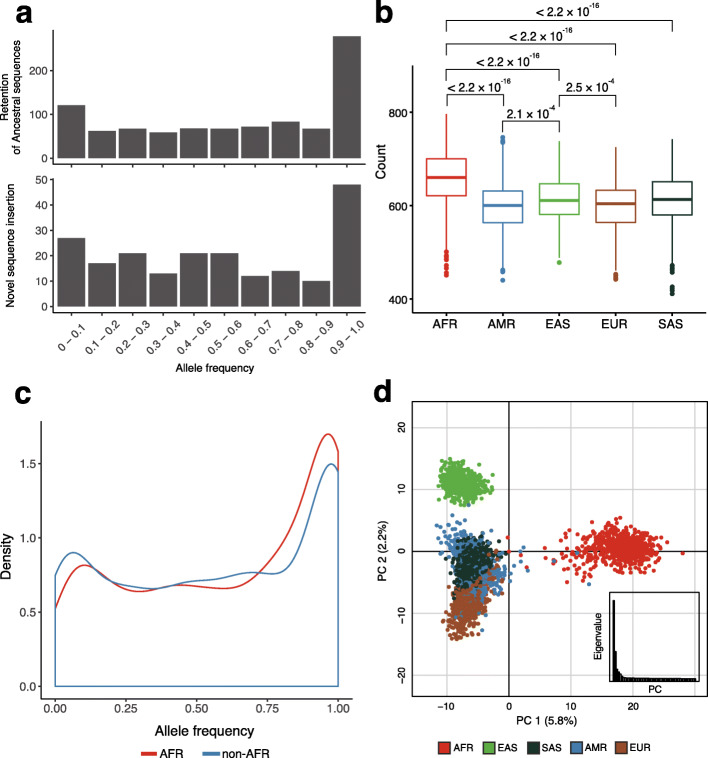
Fig. 3.
Prevalence of non-reference insertion SVs. a Allele frequency spectrum of the genotyped retention of the ancestral sequences (n = 944) and novel sequence insertions (n = 204) with respect to the ancestral status. b Number of variants from each individual, categorized according to the continental group. Significant p values of t test between the continental groups are indicated above the boxplot. c Allele frequency spectrum of the genotyped non-reference insertion SVs of African and non-African populations presented in a single group. d Principal component analysis using the biallelic genotypes of non-reference insertion SVs. Each dot represents an individual, and the colors indicate the continental groups. The first two principal components are plotted and the eigenvalues of each axis are plotted inset

