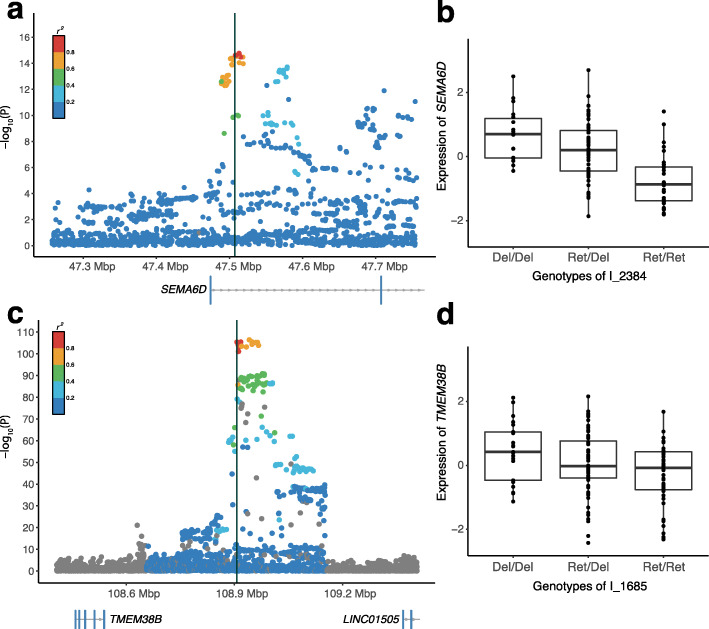
Fig. 4.
Regional association plots of phenotype-associated insertion variants. a Regional association plot of 15q21.1 for education attainment years in individuals with European ancestry. –log10(p) values of SNPs from previous studies are shown for the 250-kbp region on either side of the I_2384 variant. Each dot represents a SNP; the r2 values between the SNPs and I_2384 were computed based on data from the 1000 Genomes Project. b Expression of SEMA6D according to the genotypes of the I_2384 variant. c Regional association plot of 9q31.2 for the onset of menarche in European populations. d Expression of TMEM38B according to the genotypes of the I_1685 variant

