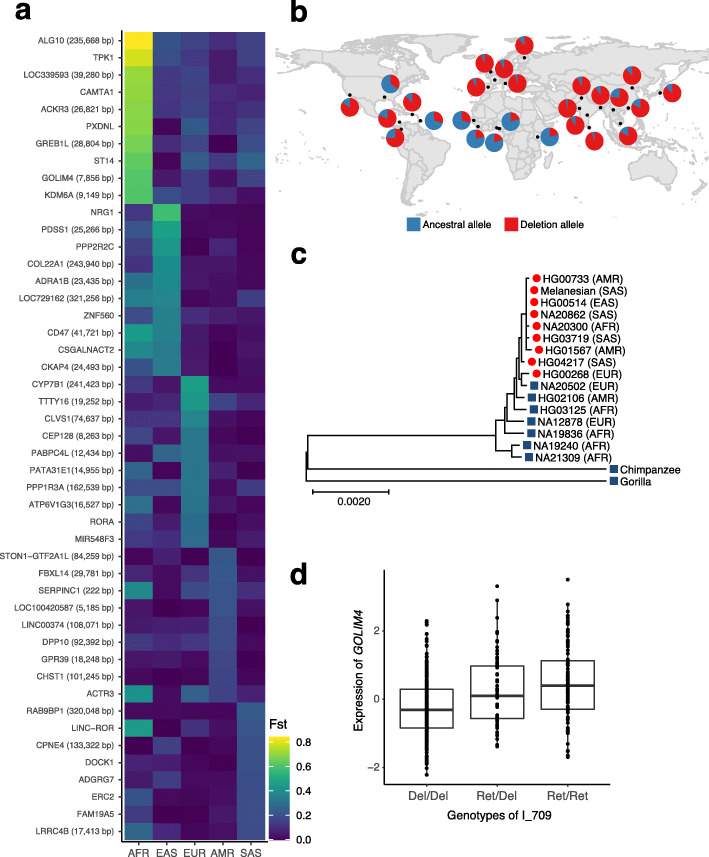
Fig. 5.
Population-stratified retention of ancestral sequences. a Top 10 FST signals in each continental group. Each row represents the non-reference insertion variants and the nearest genes within the 250-kbp range are listed with distances mentioned in parentheses. Each cell is colored according to the FST value. b Global distribution of I_709. c An unrooted maximum-likelihood tree based on the alignment of 30-kbp flanking sequences of I_709 from 16 human assemblies. Assemblies with ancestral sequences are indicated by blue boxes and those with deletion alleles by red circles. d Expression of GOLIM4 according to the genotypes of the I_709 variant

