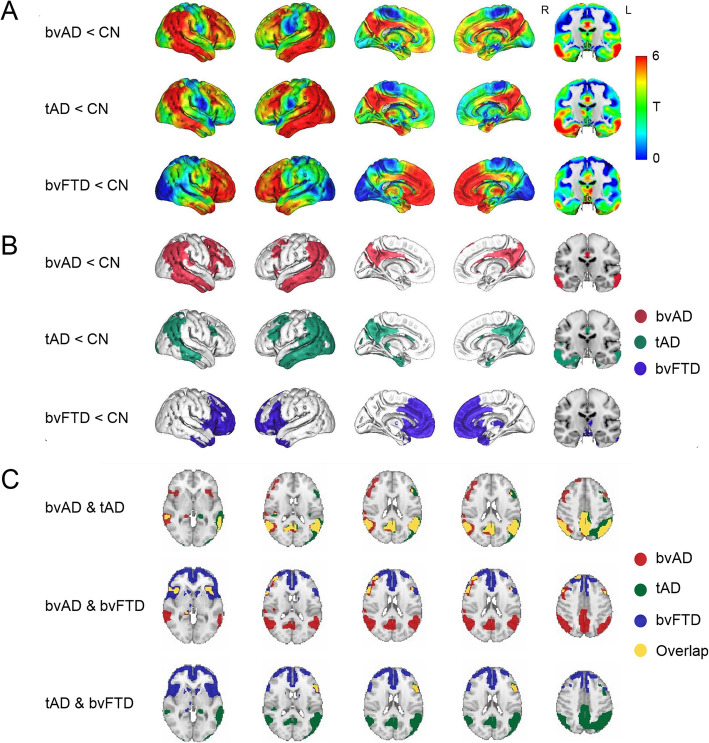
Fig. 1.
Patterns of hypometabolism of patients versus cognitively normal controls. a Surface rendering of T-maps showing hypometabolic regions in patient groups compared to cognitively healthy controls. Contrasts were adjusted for age and sex. b Surface rendering of significant voxels from contrasts between patients and controls, displayed at p < 0.05, family-wise error corrected, extent threshold k = 50. c Overlay of the T-maps from the voxel-wise comparison of FDG-PET SUVr between patients and controls. Overlays are displayed at p < 0.05, family-wise error corrected, extent threshold k = 50. Cerebellum was removed for visualization purposes

