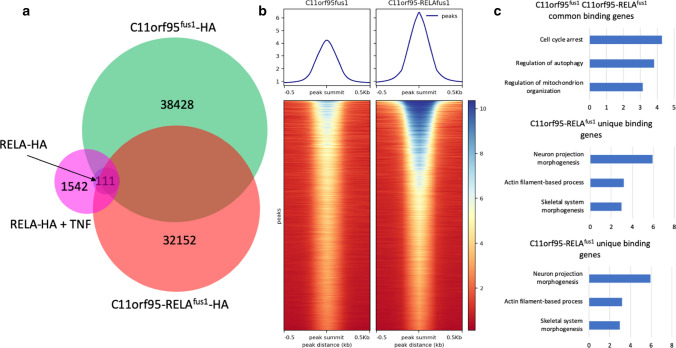
Fig. 1.
a Venn diagram of ChIP-seq peaks. The DNA pull-down were done by RELA-HA (blue, the smallest circle) in G16-2 cells, RELA-HA after TNF treatment (magenta) in G16-2 cells, C11orf95fus1-HA (green) in G16-3 cells and C11orf95-RELAfus1-HA (red) in G16-4 cells. The numbers indicate the total peaks identified in each cohort. The Venn diagram is not dawn to scale. b Read densities over ChIP-seq peaks of C11orf95fus1 and C11orf95-RELAfus1. Using peak summit as the center, the normalized mapped reads over a 1 kb region around the peak were plotted for a total of 16,829 shared peaks of C11orf95fus1 and C11orf95-RELAfus1. c Gene ontology analysis on C11orf95fus1 and C11orf95-RELAfus1 common binding genes, C11orf95fus1 unique binding genes and C11orf95-RELAfus1 unique binding genes. The top three ranked biological processes according to q value are shown

