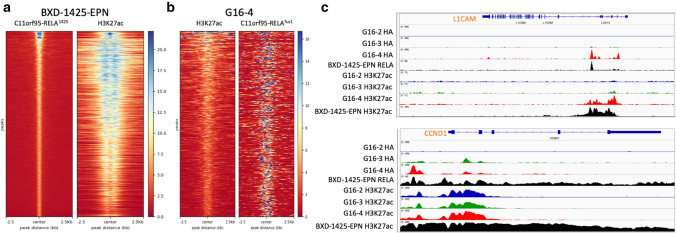
Fig. 3.
a ChIP-seq read densities of C11orf95-RELA1425 and H3K27ac in BXD-1425-EPN cells. 3792 top-scoring C11orf94-RELA1425 ChIP-seq peaks were used to plot the heatmap. The left side heatmap showed C11orf95-RELA1425 signals along a 5 kb region centering the peak summit. The right side heatmap showed H3K27ac signals along the same regions. b Read densities of H3K27ac and C11orf95-RELAfus1 in G16-4 cells. 441 differential H3K27ac peaks in G16-4 compared to G16-2 cells were used to plot the heatmap. The left side heatmap showed H3K27ac signals along a 5 kb region centered with H3K27ac peak center. The right side heatmap showed C11orf95-RELAfus1 signals along the same regions. c RELA, C11orf95fus1, C11orf95-RELAfus1 and C11orf95-RELA1425 as well as corresponding H3K27ac ChIP-seq profiles at ST-EPN-RELA marker genes CCND1 and L1CAM

